

Data Corner: Are IPL Pitches A Problem?
Much has been made about India’s inability to adapt to tougher pitches, but are IPL pitches as flat as the narrative suggests?

I am writing this the day after India lost to England in the fifth T20I of their 2026 tour to England. Four completed games of this series (the first was washed out) have been a display of contrasting batting performances from the two sides, with England, as expected, knowing the conditions better. Noticeable were Indian batters’ struggles with short and back of a length deliveries, and it was not a matter of length judgement, shot selection, or intent. In the last seven innings (2 vs Ireland, 5 vs England including the first T20I), Indian batters attacked 73.5% of these deliveries while the hosts attacked 72.5%. India played a cross-batted shot on 54.1% of these balls, the hosts on 50%. The difference lay in the outcome.
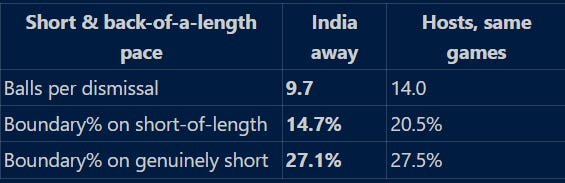
With India, it was often a misjudgement of the bounce that proved costly. Their control percentage on these shots against pace across these seven innings was 54.5%, compared to 59.8% in the IPL, where they could trust the bounce.
With this, criticism of IPL flat pitch homogenisation is at its peak, and I try to validate here, with data, whether what our eyes have told us has any truth to it. I use the Pitch Variability Index (PVI: how different conditions were across venues in a season) and Match Variability Index (MVI: how different conditions were across matches in a season) to examine how surfaces across venues and individual games have differed from each other across every IPL season from 2022 to 2026.
The Metrics
To characterise a pitch, we track five ball-tracking metrics captured on every delivery, each isolating a distinct physical property of the surface.
Coefficient of restitution captures how much of the ball’s energy survives the bounce, distinguishing a lively, fast-scoring pitch from a dead, low one.
Coefficient of friction measures the grip between ball and surface on impact.
PBR (pace retained)1 tracks how much of the ball’s pre-bounce speed carries through after impact, separating pitches that hold their pace from ones that visibly slow the ball down.
Turn/seam magnitude, taken as the absolute lateral deviation of the ball after pitching, is the most direct measure of how much a surface actually moves the ball sideways, independent of which direction.
And swing magnitude, while primarily an aerial, pre-bounce phenomenon governed by the ball’s condition and the bowler’s wrist, is included because a pitch’s grass cover, abrasiveness and local atmosphere still leave a detectable signature on how much the ball swings there. Together these five variables span the full story of a delivery’s encounter with the pitch giving a multidimensional fingerprint of a surface.
Isolating Pitch Effects
Processing these five metrics by venue sounds straightforward, but it isn’t. A raw average conflates the surface with the bowling it happened to face. A ground that gets bowled more spin will show more turn regardless of its own grip, a venue that hosts slower bowlers will show less pace retention no matter how true the pitch actually plays. To isolate the surface from the delivery, every metric is run through a fixed-effects regression: each ball is modelled as a venue (or match for MVI) effect plus a set of delivery-mechanics terms - pace, trajectory, where it was pitched, spin versus seam, and how those interact estimated jointly across tens of thousands of deliveries.
The venue effect that falls out of that regression is what the surface would produce for an average delivery, stripped of whichever bowlers happened to show up. It’s the difference between “this ground’s pitch averages more turn” and “this ground’s pitch averages more turn than an average pitch exposed with the same delivery characterisitcs”. Only the second claim is actually about the pitch.
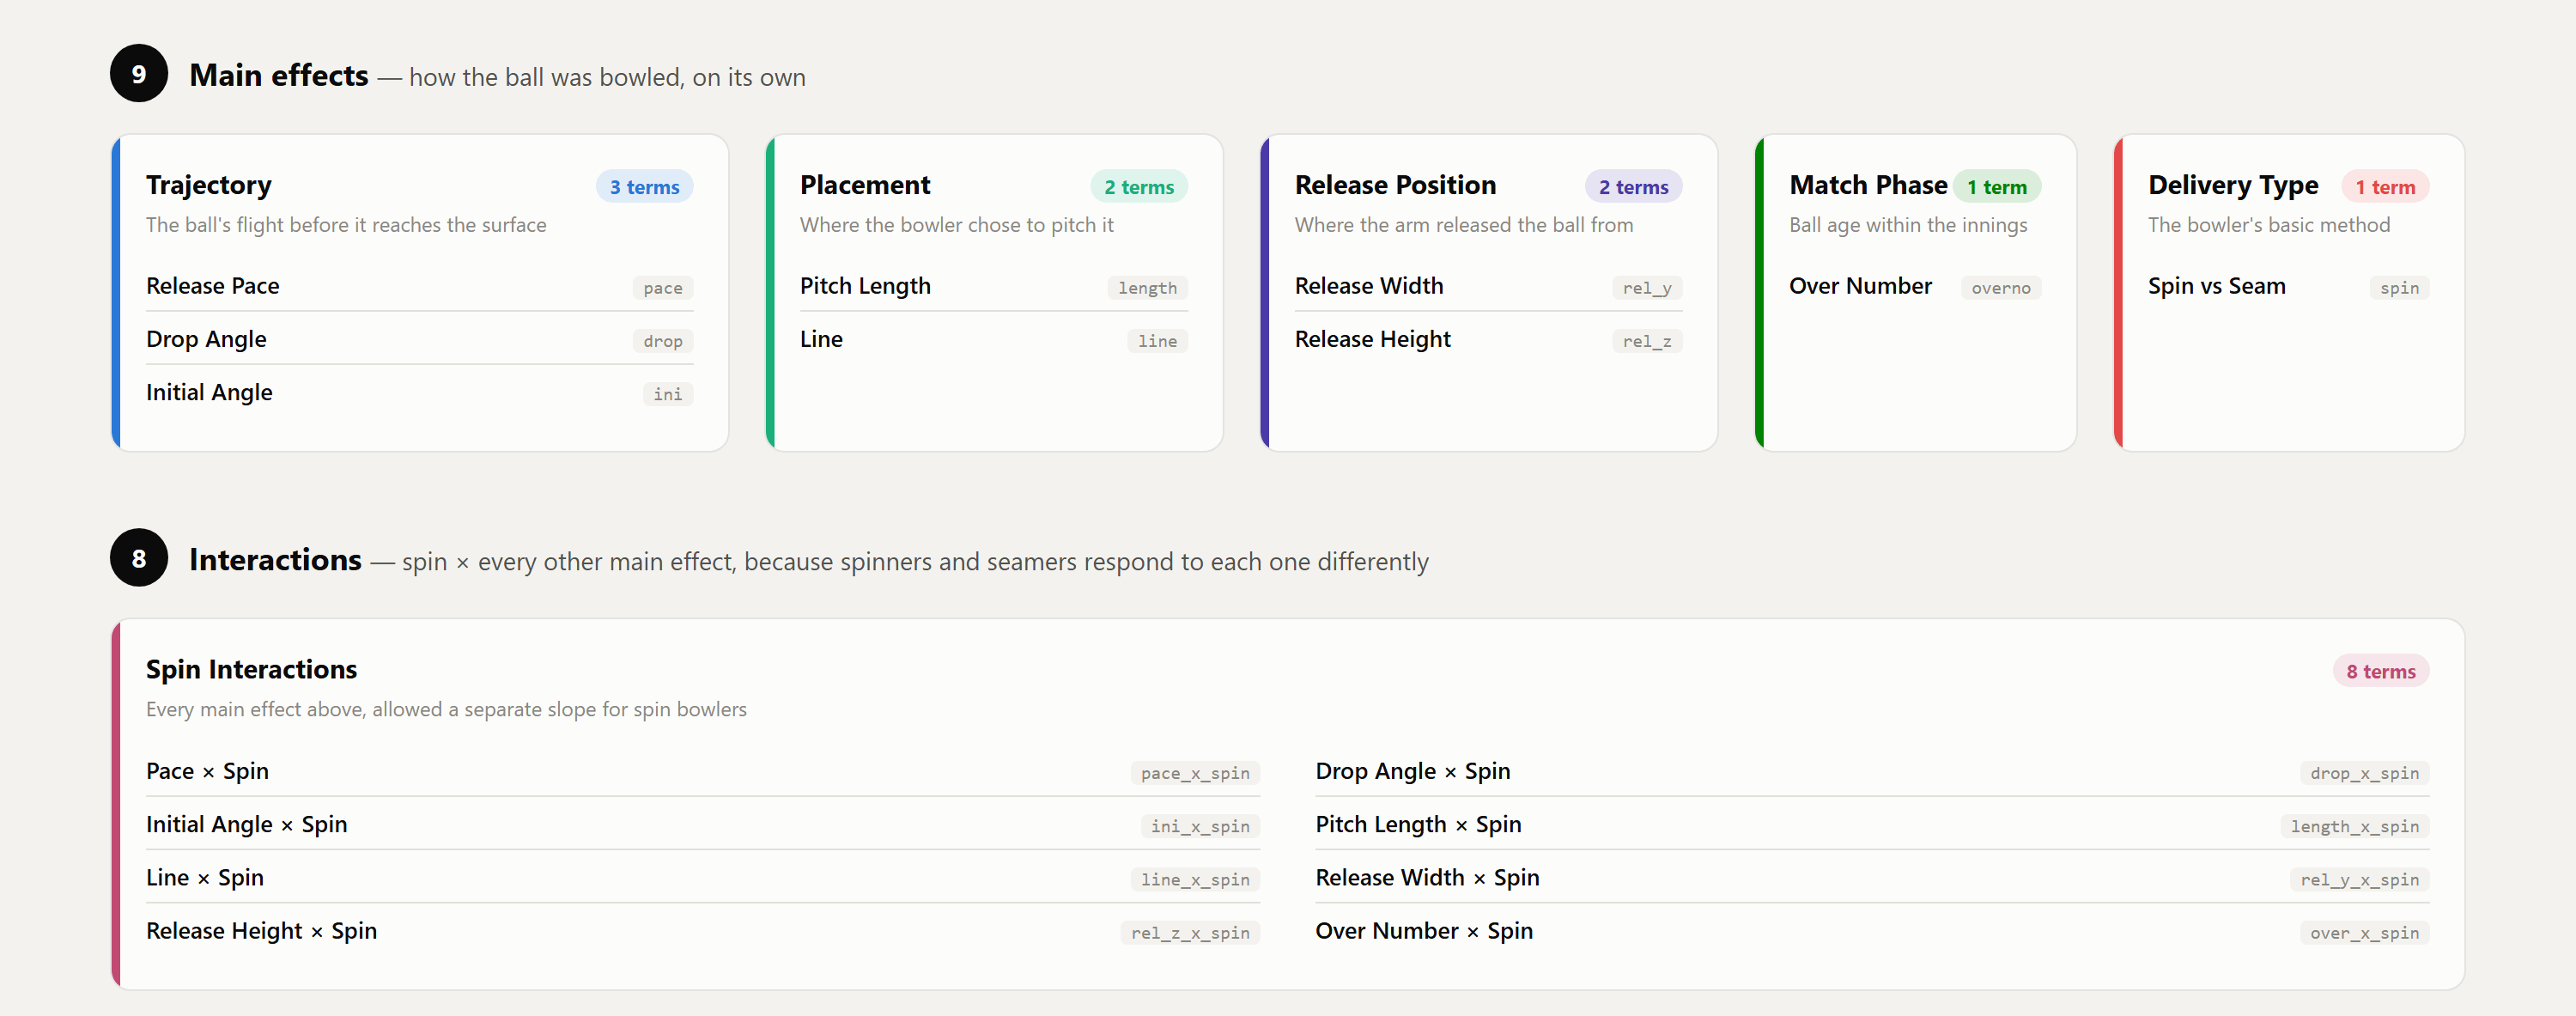
The image above lists all delivery mechanism terms considered. Beyond the main effects, we include an interaction set between the variable “Spin”, which is a binary indicator of bowler type (0 for pacer, 1 for spinner), and all other main effects. This is because each of these effects behave differently depending on whether the bowler is a seamer or a spinner.
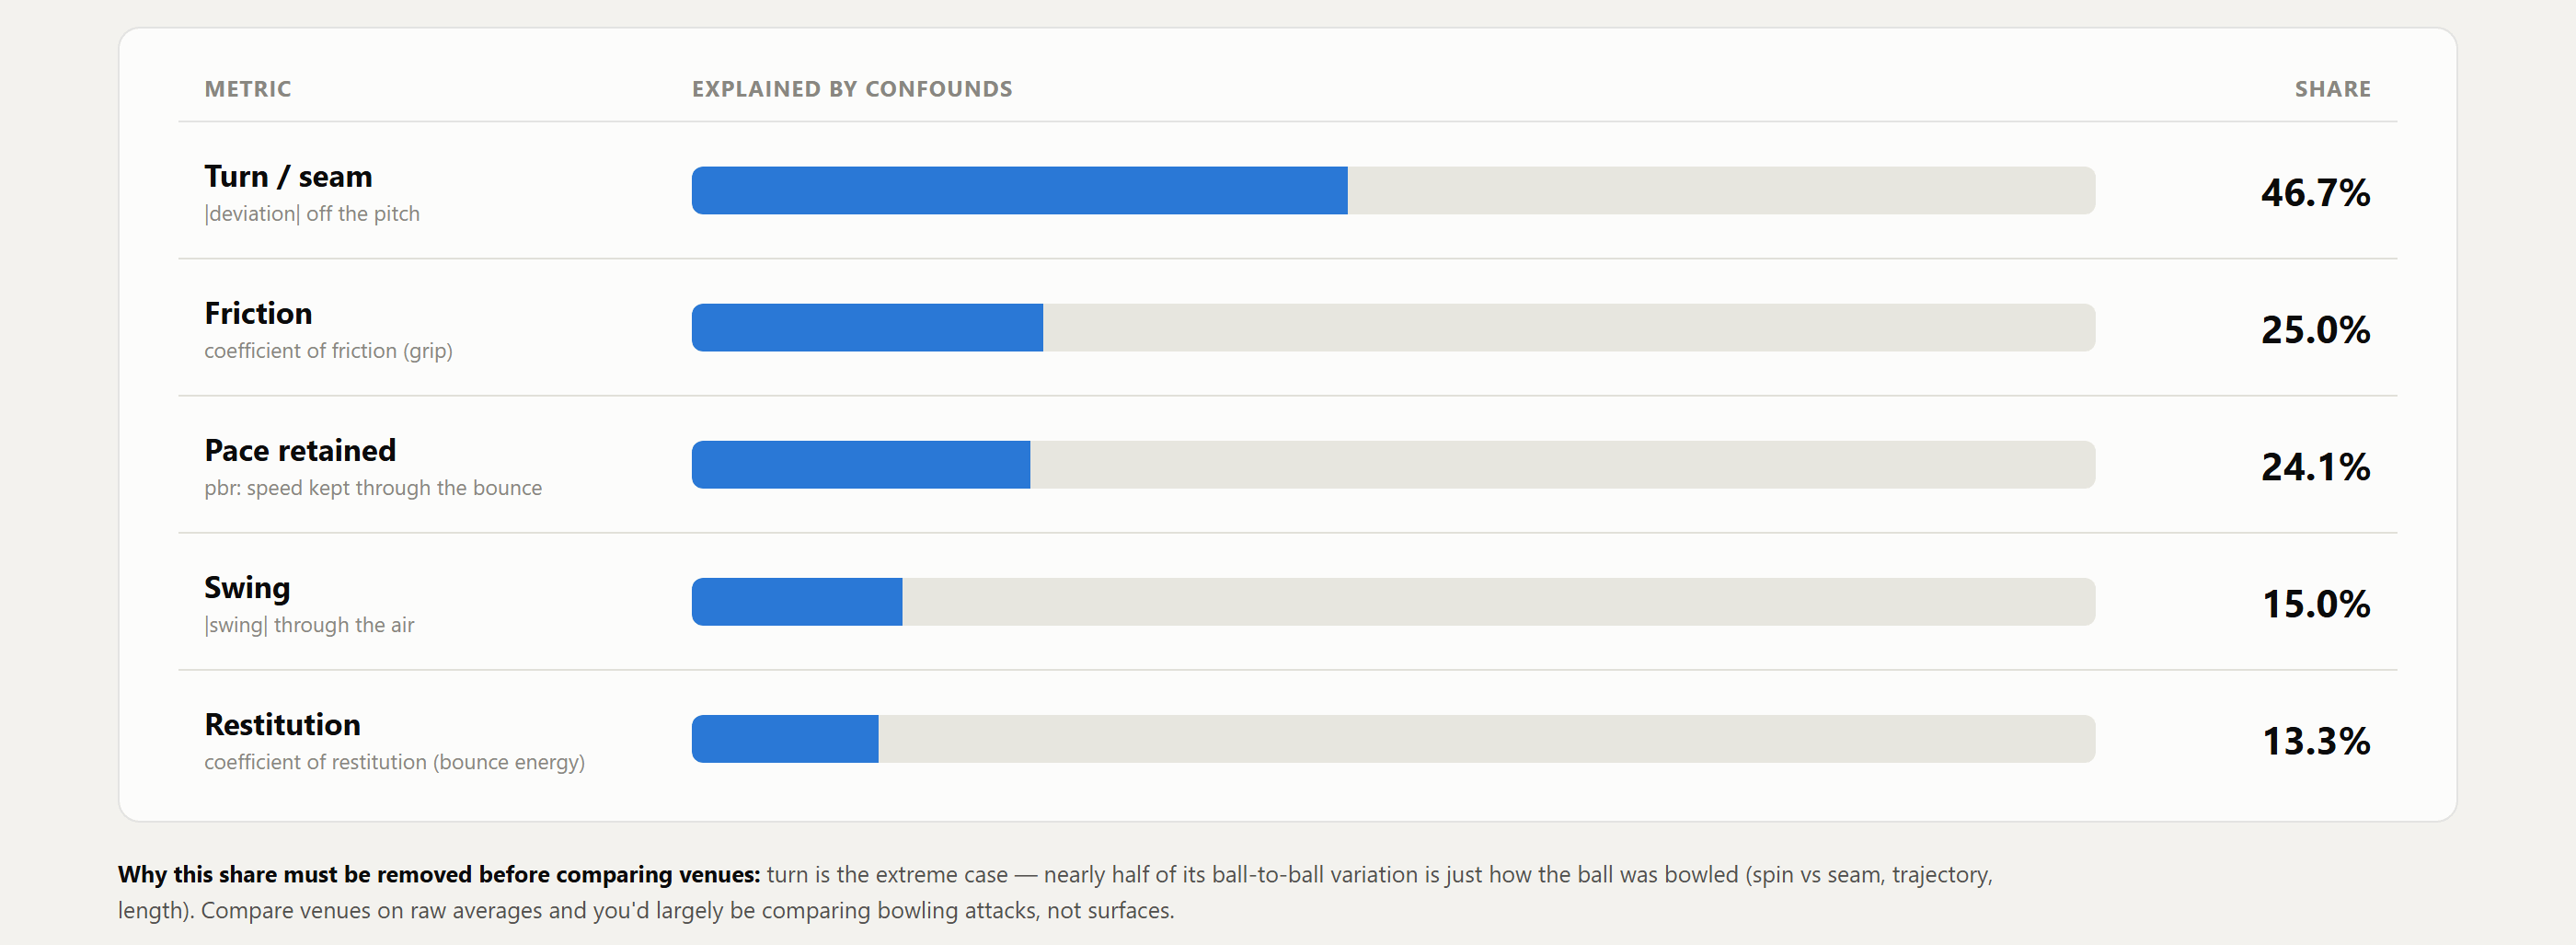
We then see how much of the variance in our five base metrics is explained by these effects and interactions.2
The Indices
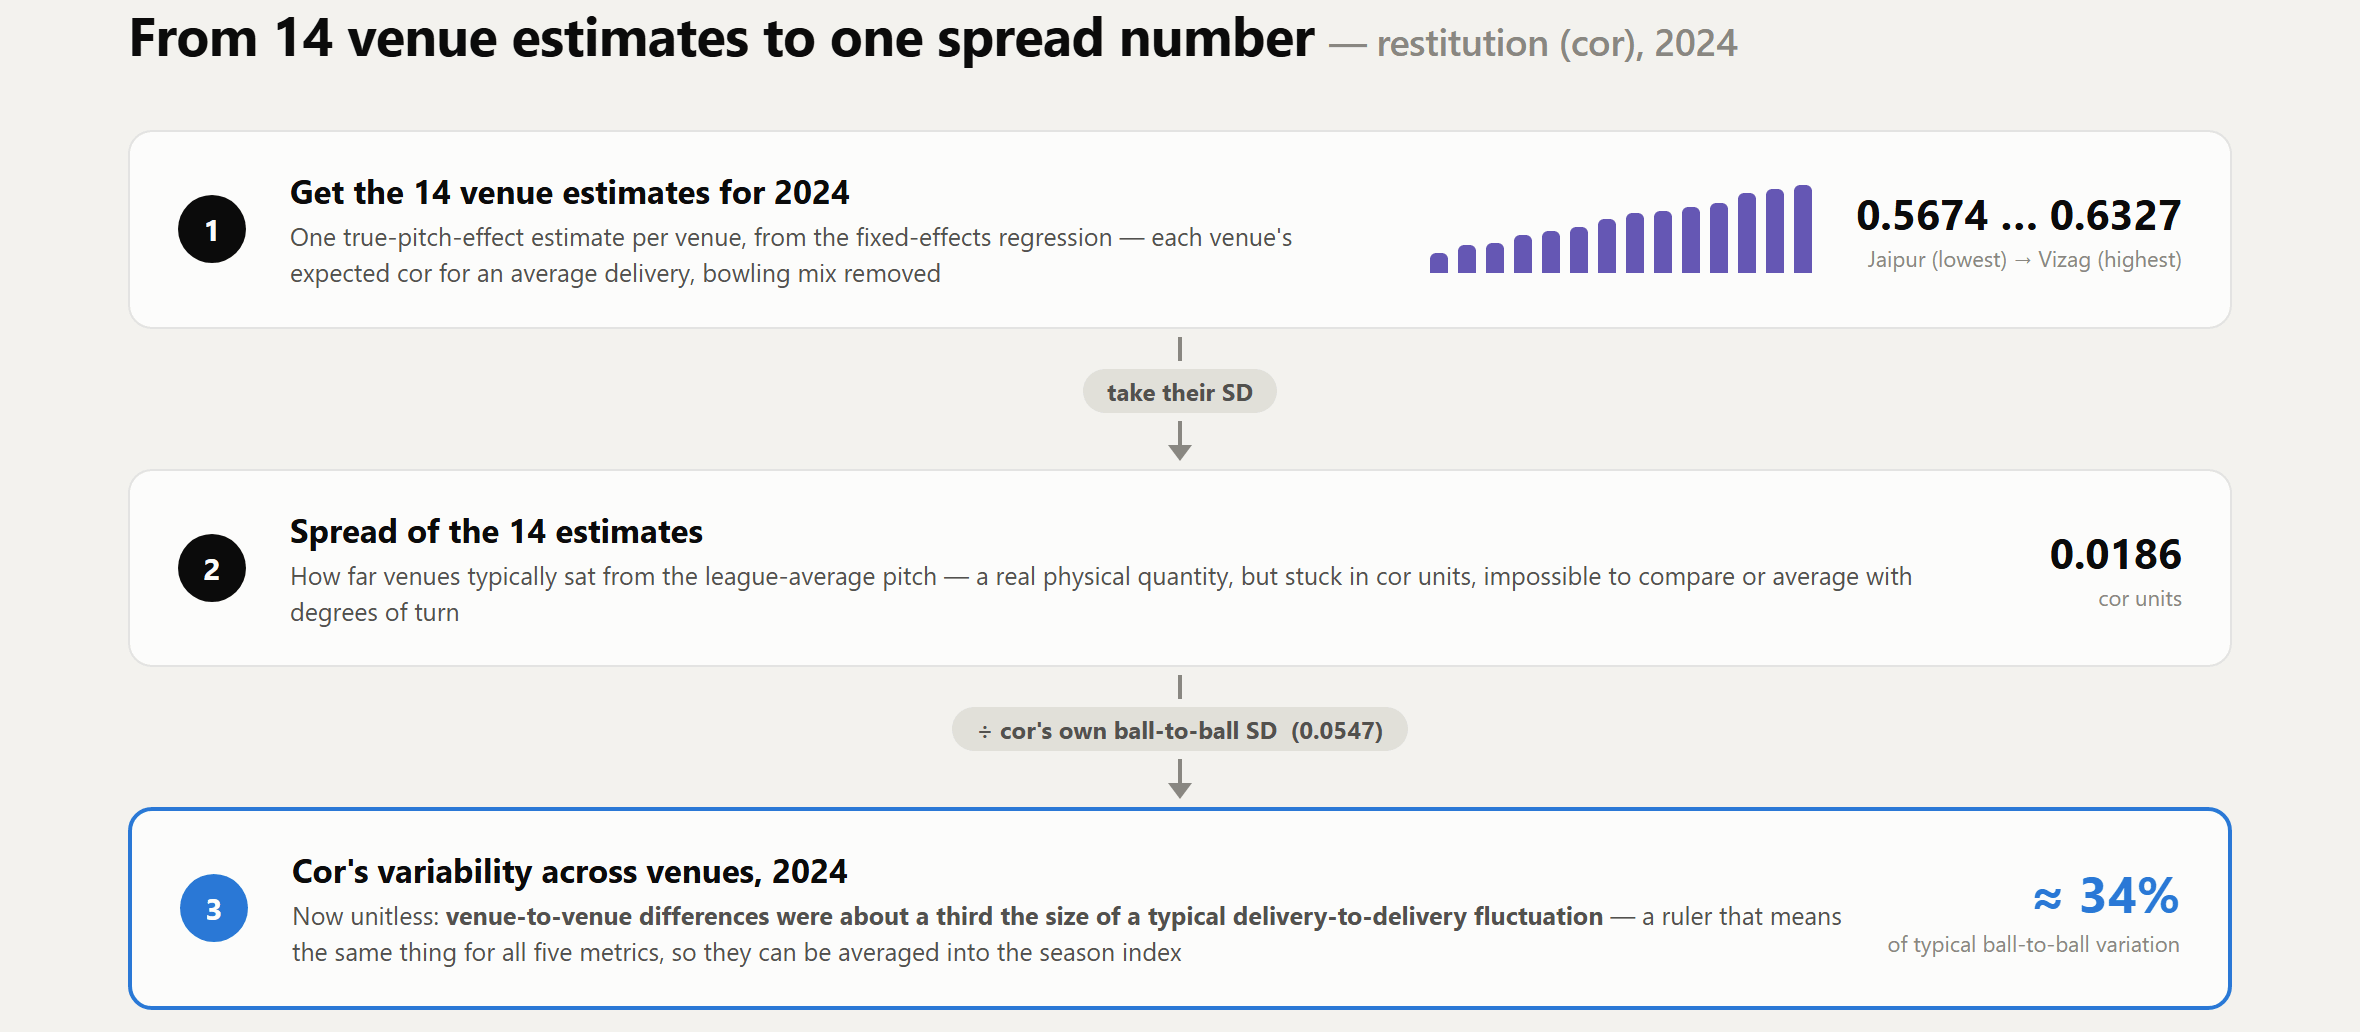
The fixed effect regression yields estimates for each base metric as a function of venue-season pair. These estimates are the true pitch effects3 (TPE) on each base parameter, with delivery characteristic biases removed. We then examine how TPE values for a given metric differ across all venues within a season and normalise this deviation to derive the metric variability for that season. Here is an example:
We average each metric’s (m) variability for the season (s) to get that season’s Pitch Variability Index:
Here, the NormSD for COR (restitution/bounce) in 2024 is the 34% we saw in the example figure (this will not match actual results as we skipped resampling in that example).
Repeating the same steps with a match-year pair as the target group instead of a venue-year pair gives us the Match Variability Index (MVI). PVI measures how different venues were within an IPL season, while MVI is needed because conditions at a particular venue are not constant throughout a season either. Wankhede 2025, for instance, might produce two very different games due to a pitch change or weather conditions.
Results and Interpretations
Here’s the season wise trend for PVI:
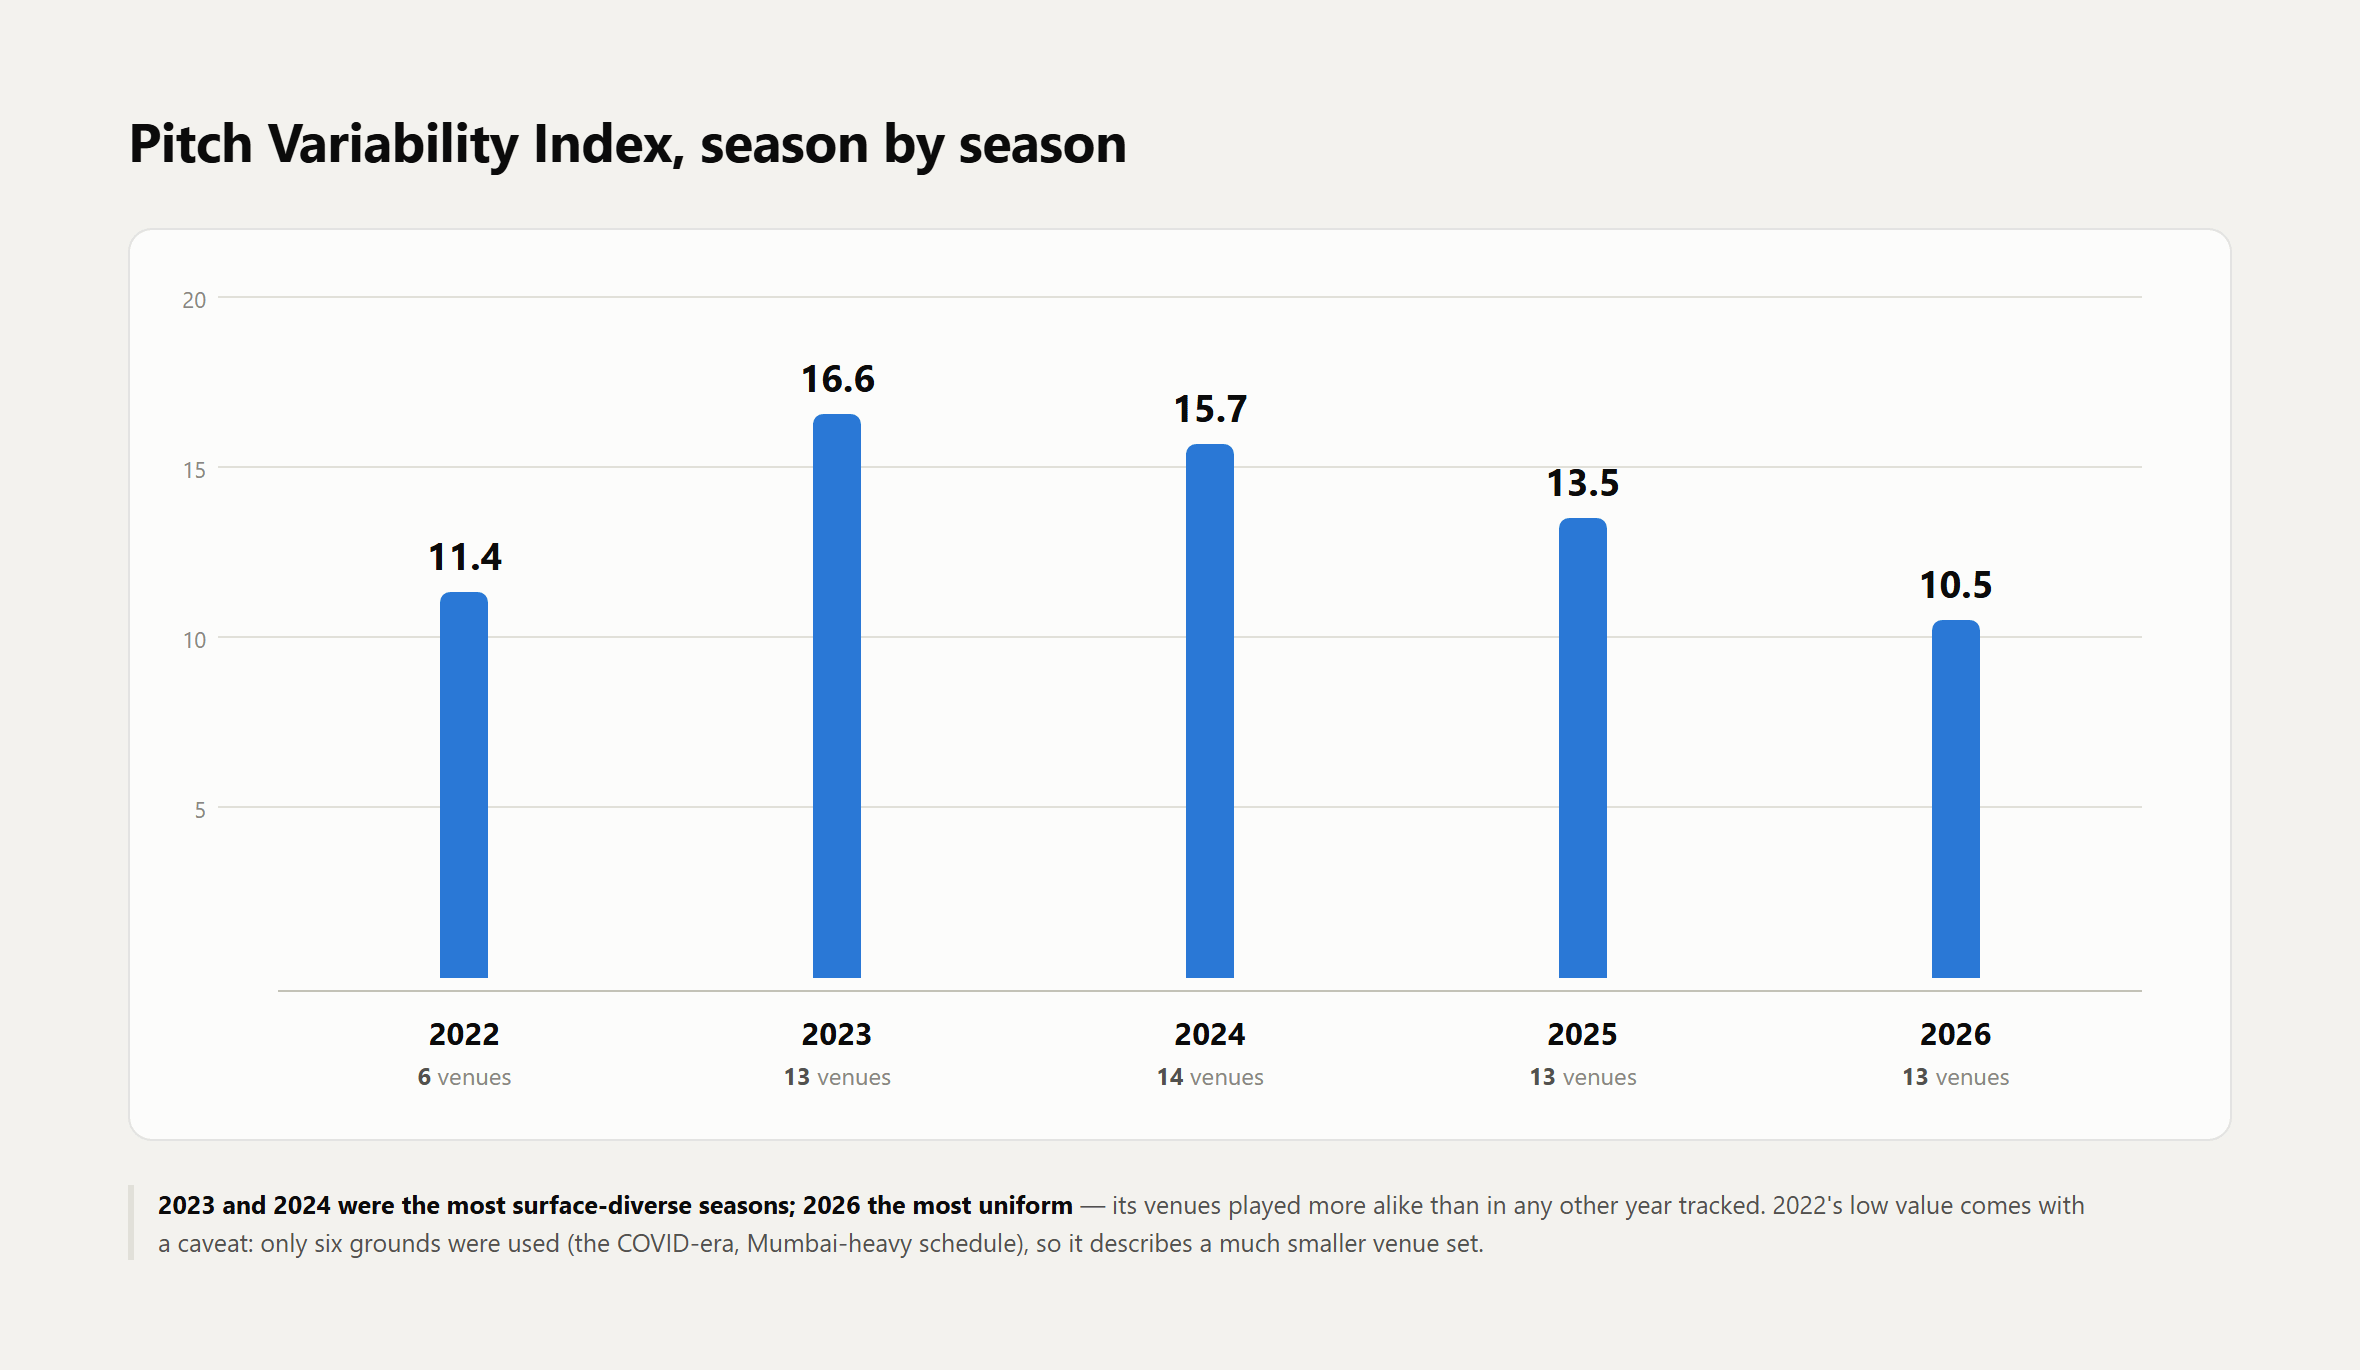
As the graphic explains, IPL 2022 is something of an exception. Not only were there just 6 venues, but the entire league stage was held across 4 stadiums in the same state (Maharashtra), so the low PVI there is expected. What is striking is the trend that follows. Venue differences have been steadily diminishing, and IPL 2026 ultimately beats even 2022 on this front.
Analysing which base metrics drive this change further solidifies the flat pitch homogenisation observation. I looked at this from a venue perspective: how did each base metric shift across venues in 2026 compared to the 2022 to 2025 average?
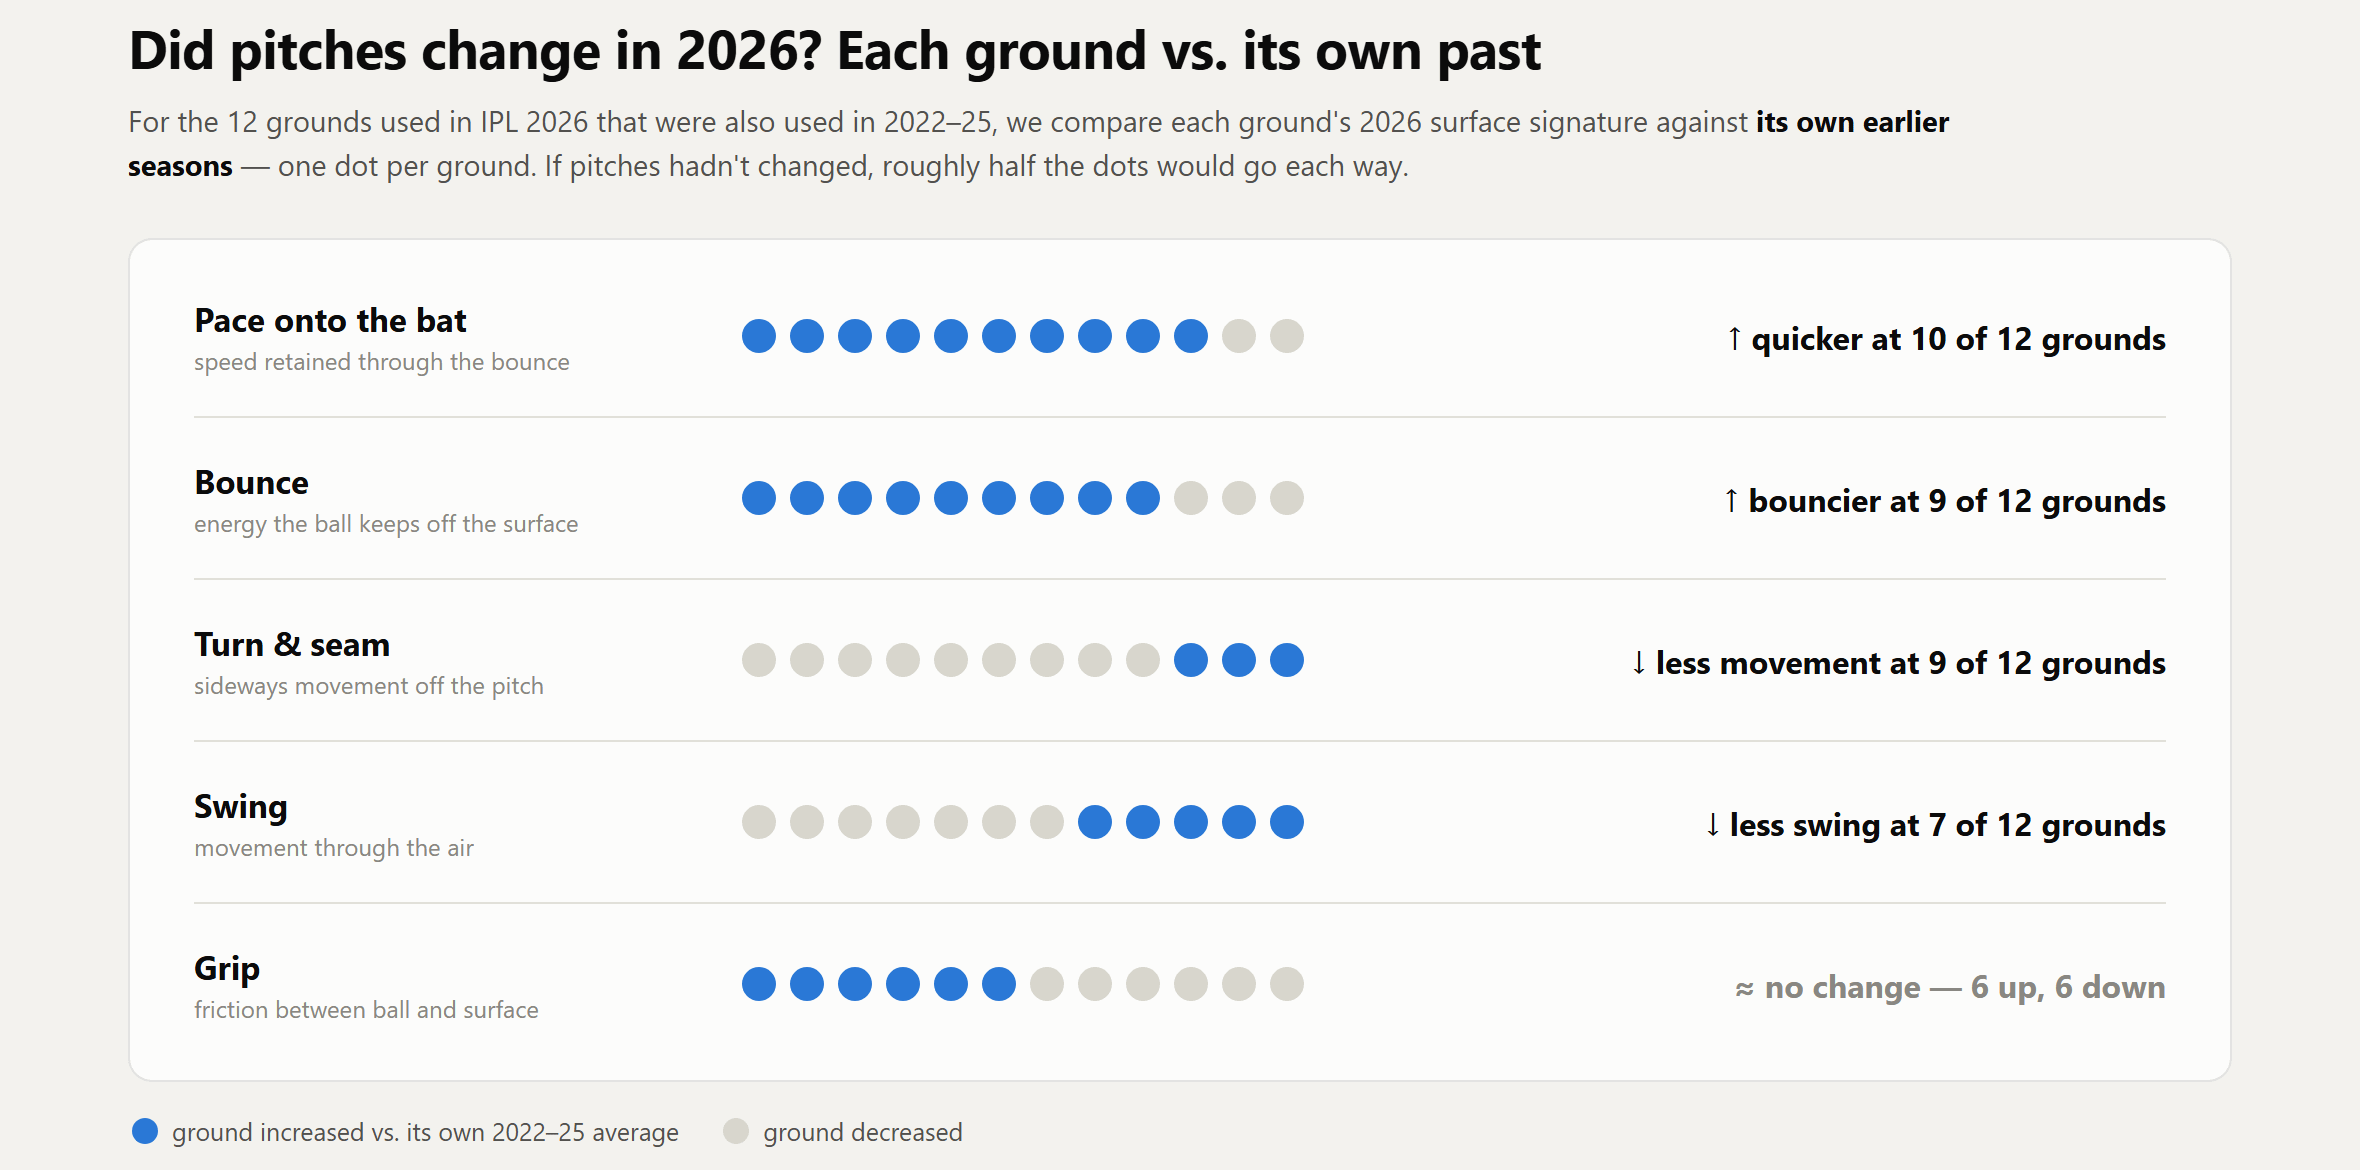
The pattern points one way: 2026 surfaces got quicker and bouncier while turning and swinging less, producing flatter and truer pitches almost everywhere in a country historically known for sluggish conditions. Raipur is excluded as it appeared only in 2026 and has no earlier baseline to compare against. This also illustrates an important point about batting: the IPL currently is a truer test of a batter’s ability against pace than against spin. No disrespect to the good spin hitters out there, but batters in the IPL are mostly facing fairly innocuous spin. There probably is not enough signal in the league to draw meaningful conclusions about their hitting level against spin.
A more detailed venue wise graphic of 2026 is shown here:
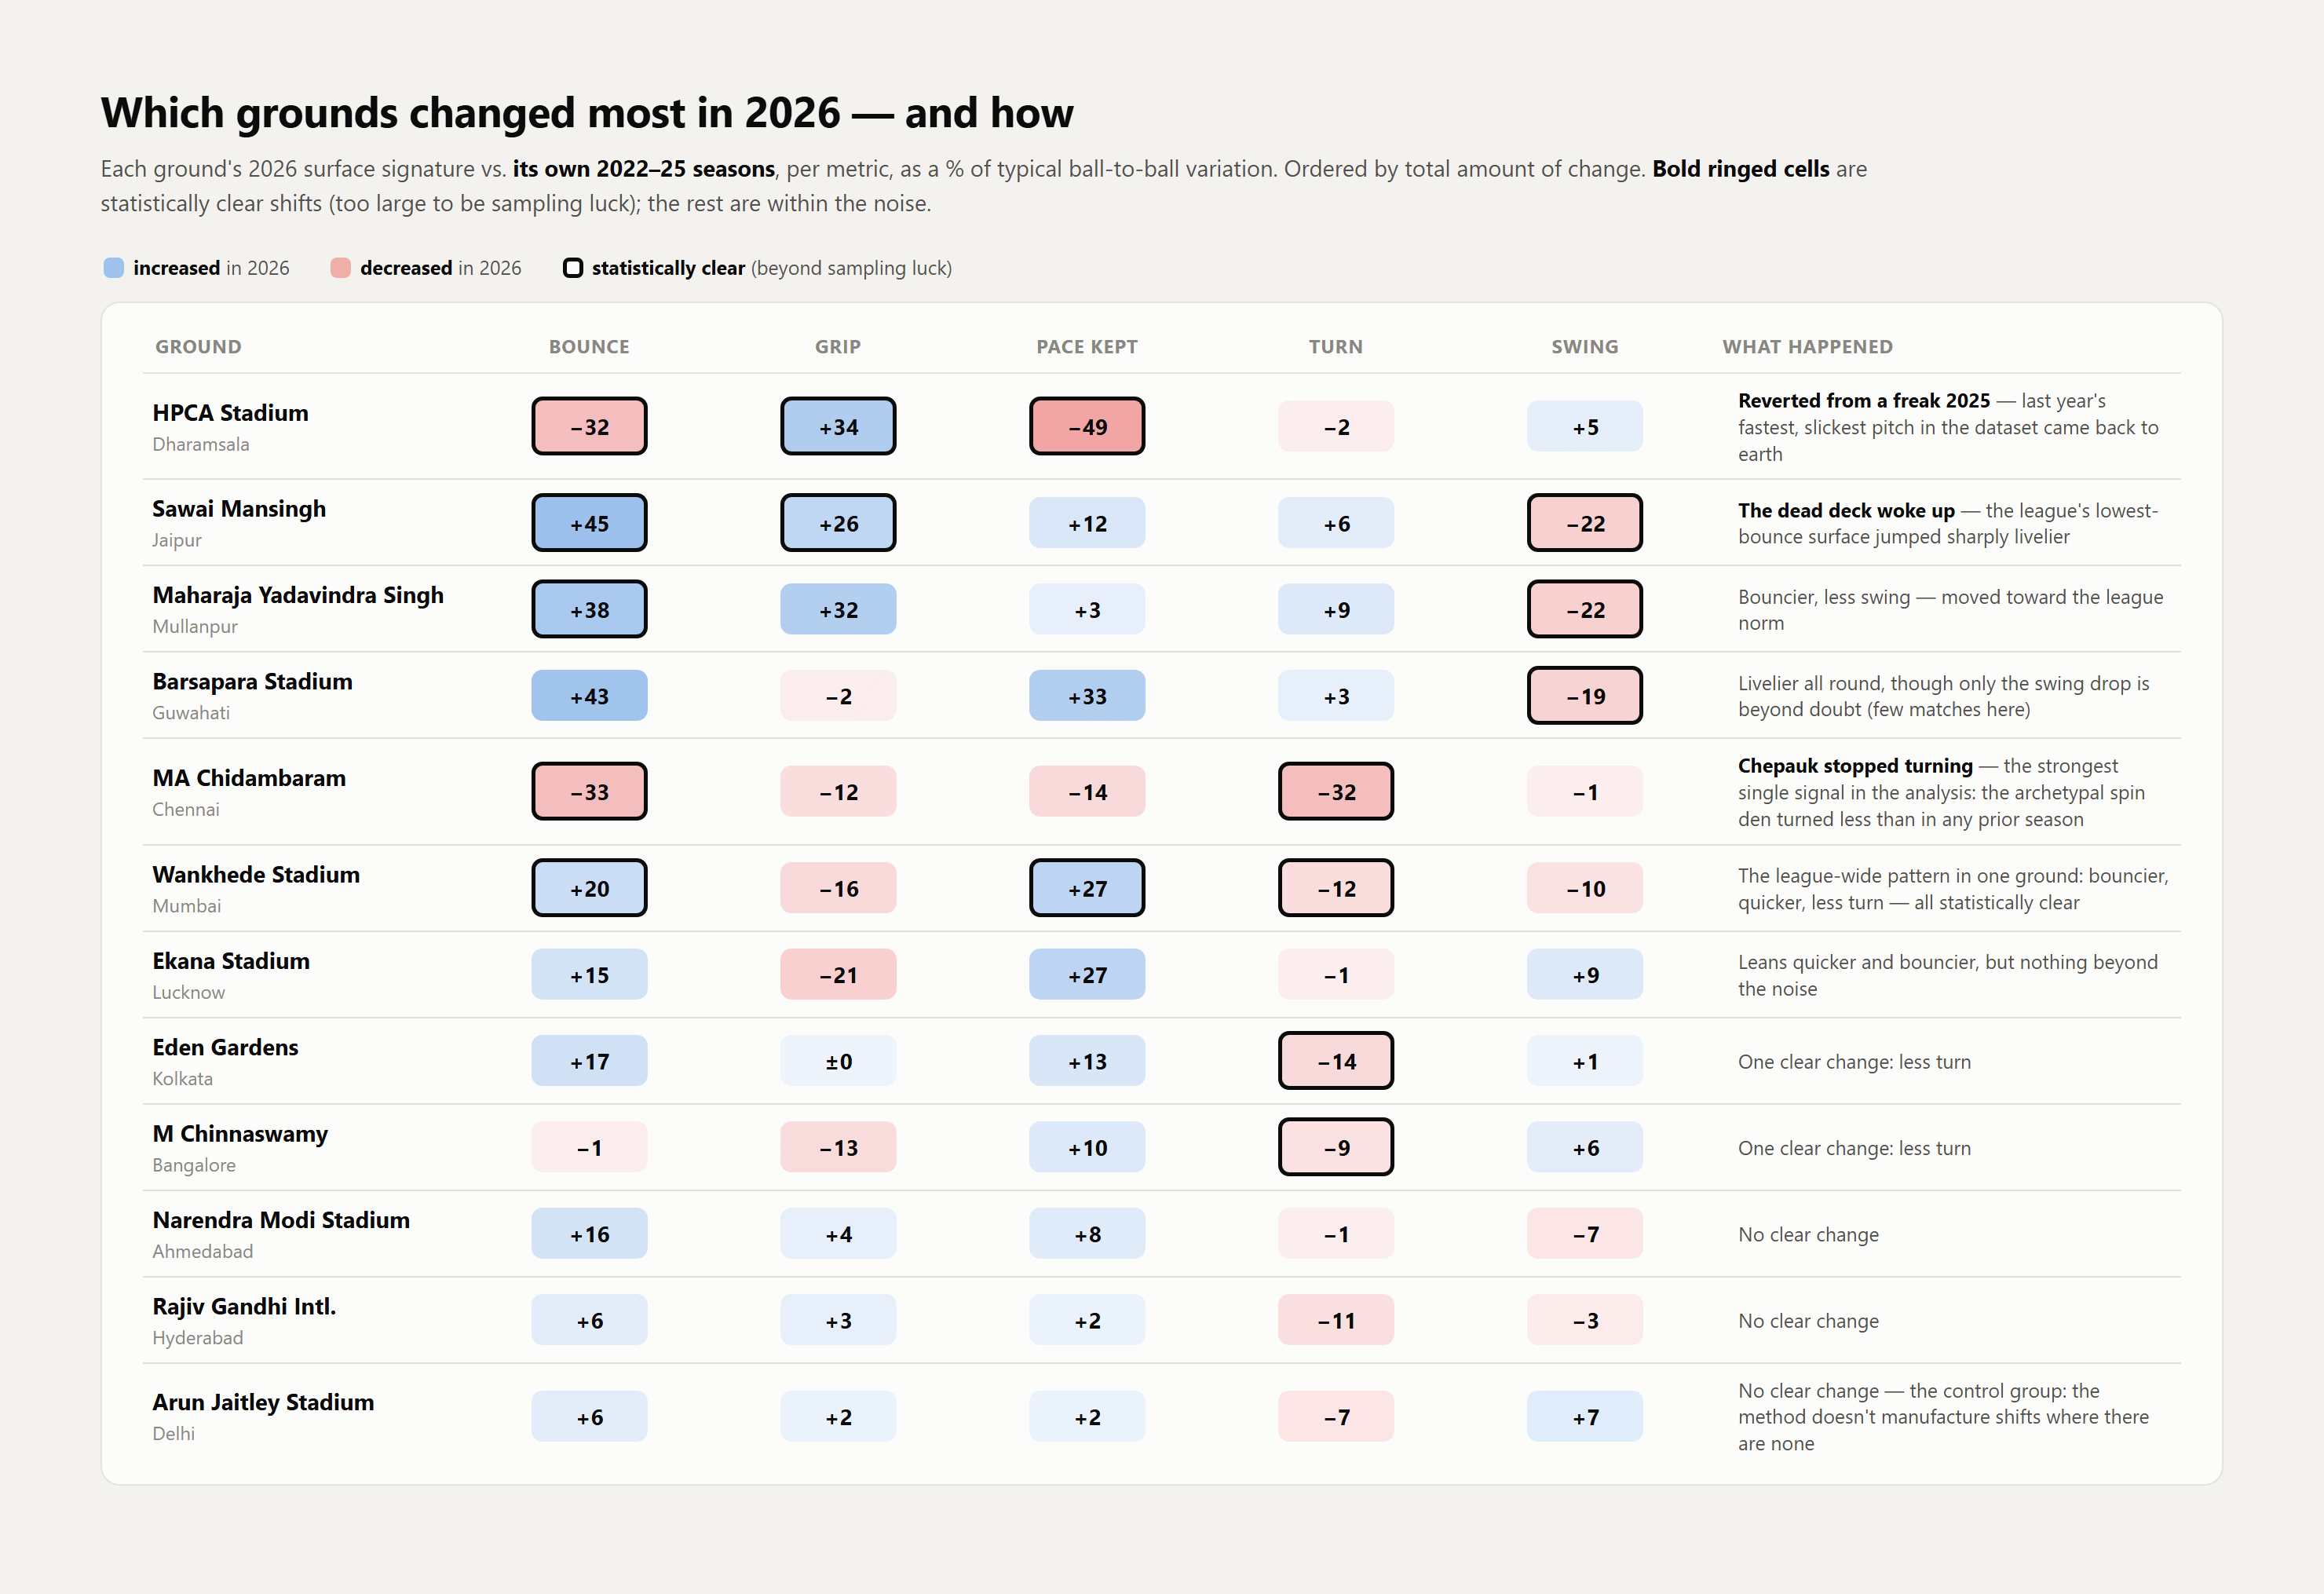
The problem is that the bounce and pace increase takes place on pitches that were on the lesser side by global standards. There is no extra bounce on an average IPL 2026 pitch, just true bounce, along expected lines, as one would get on a surface with no particular nuance. Bounce data from the India-England series, put in comparison with IPL 2026, illustrates this point well.
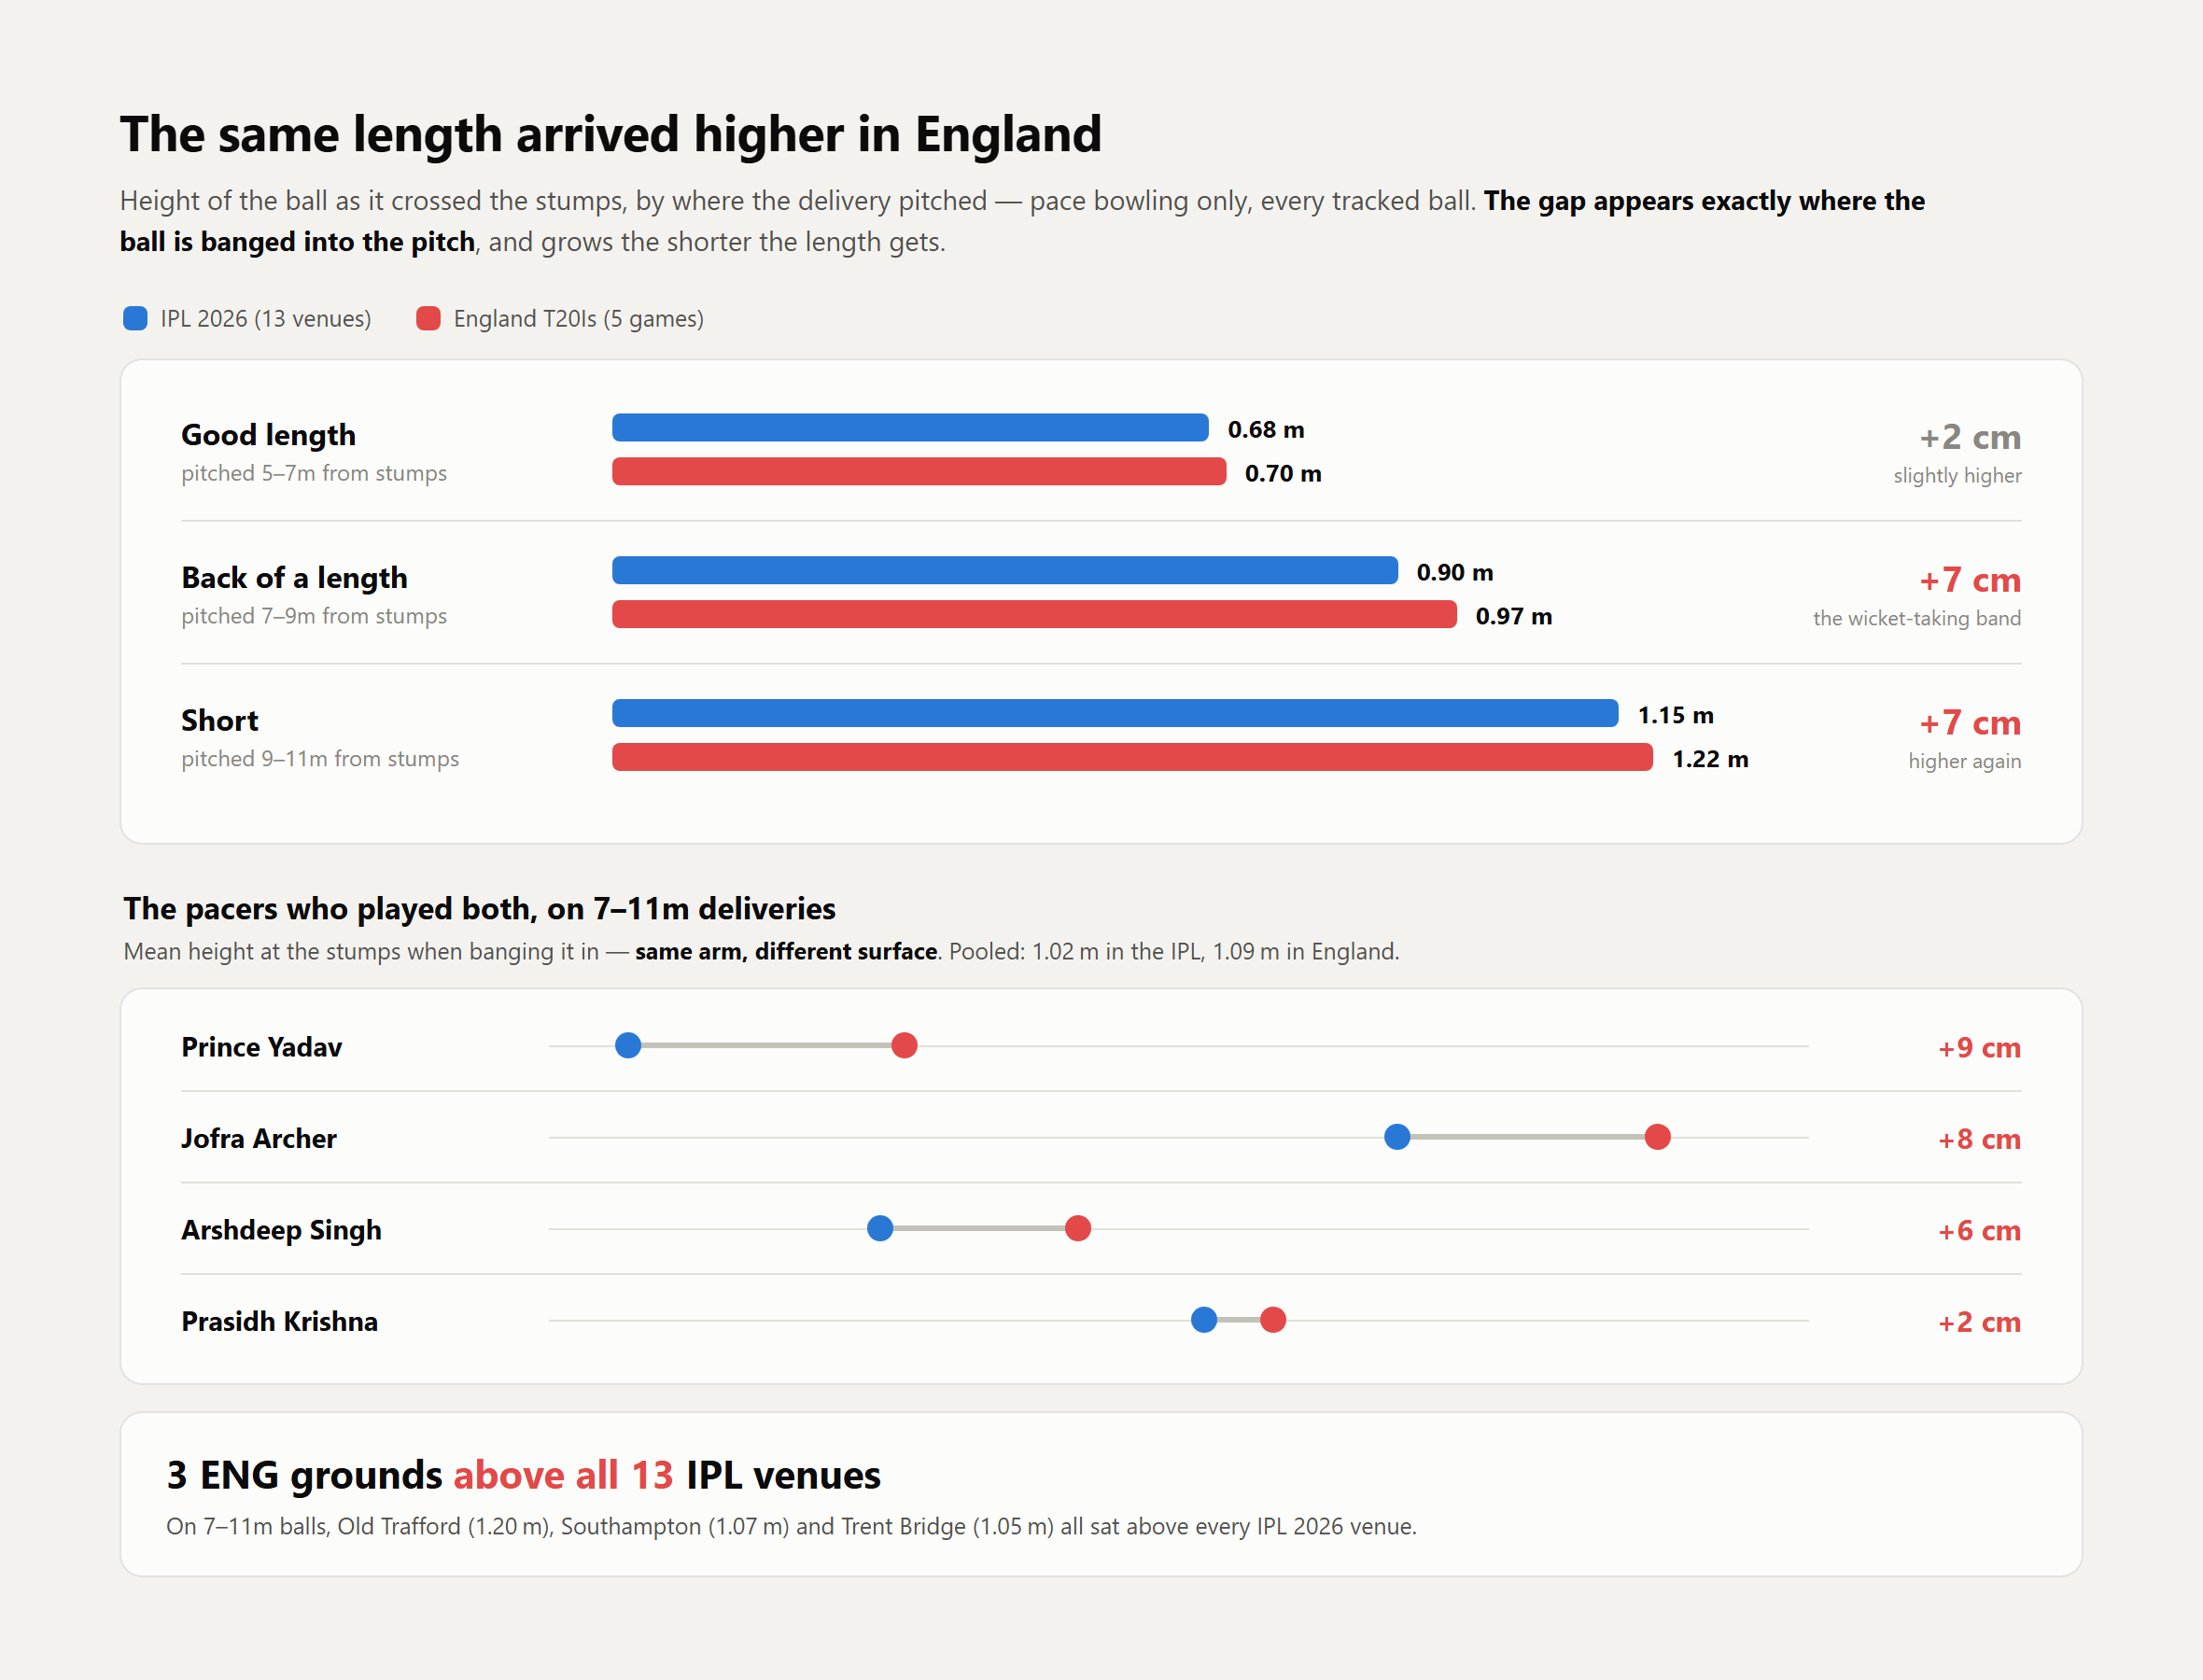
Even within length bands, there can be a composition bias based on the exact length bowled. To confirm this further, I evaluated India-England series deliveries against IPL 2026’s length versus height fitted curve. Findings were similar: +5.5 cm on back of a length, +7.1 cm on short. The four bowlers common to both were +7.4 cm higher in England compared to the IPL.
A batter calibrated on IPL 2026 bounce meets the same short of a length ball arriving about seven centimetres higher, with more variation ball to ball: the difference between a pull off the middle and one off the splice.
Another notable trend in 2026 is that it recorded the highest swing variability among all five seasons considered. This was observable on the ground as well, with prolonged swing at specific venues catching the eye. Ekana offered the most swing (+12.8%), enabling a young LSG pace battery to operate efficiently, followed by Chinnaswamy (+11.1%). Jaipur (-17.1%) and Mullanpur (-15.4%) sat at the bottom. As noted earlier, swing differences attributable to pitch reduce substantially when the bowler is included as a mixed effect. Even so, 2026’s swing variability remained the highest at 2.78 in that case.
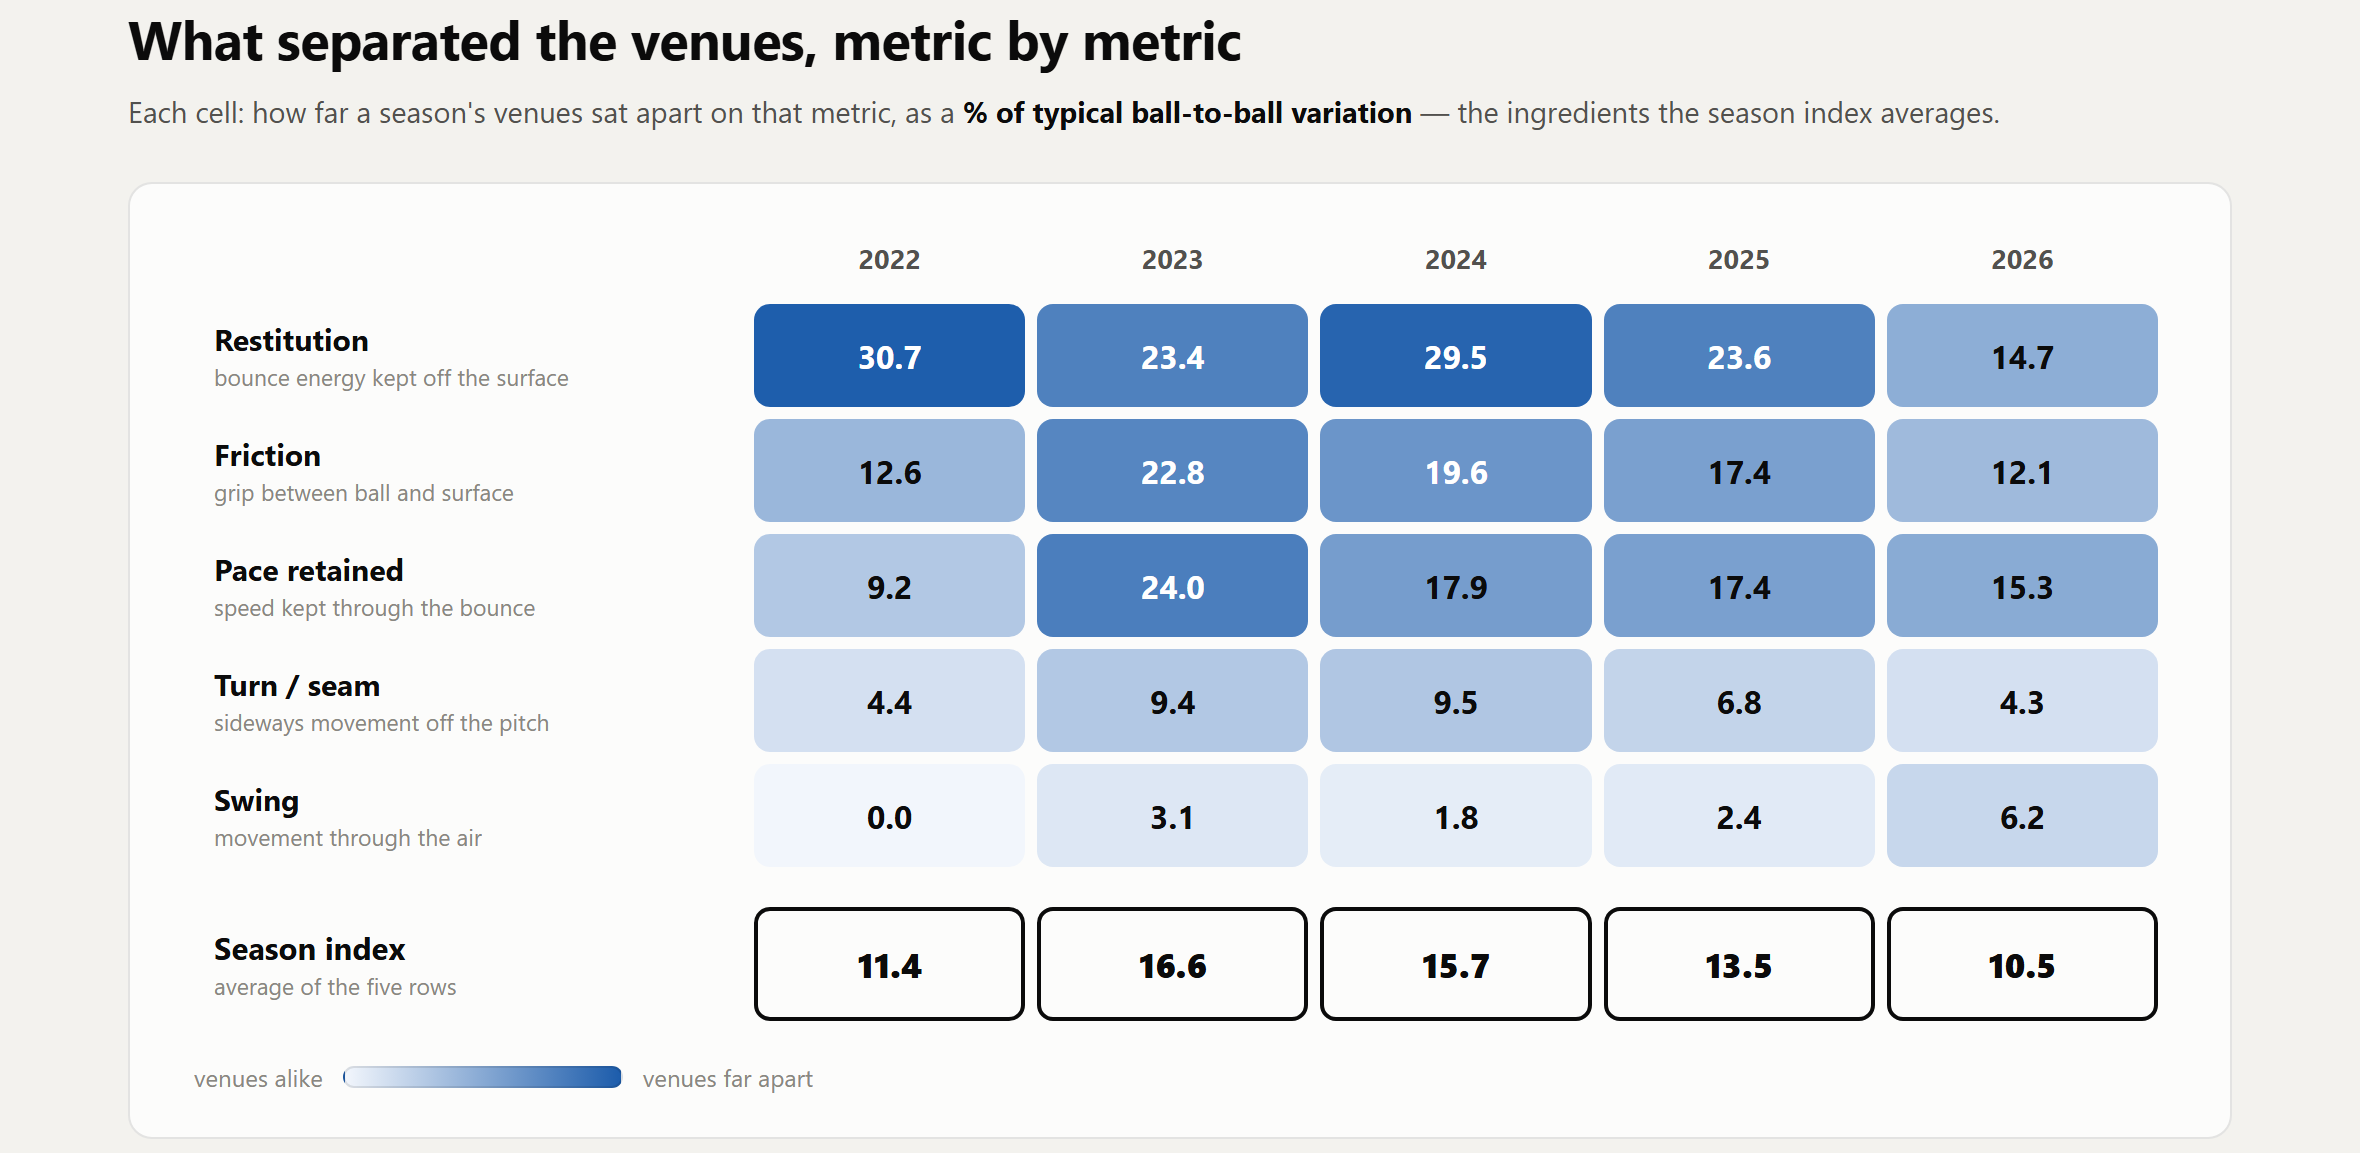
While PVI gave a sense of how far apart were the venues in a season. MVI informs about how different were individual games. For 2026, story remains the same:
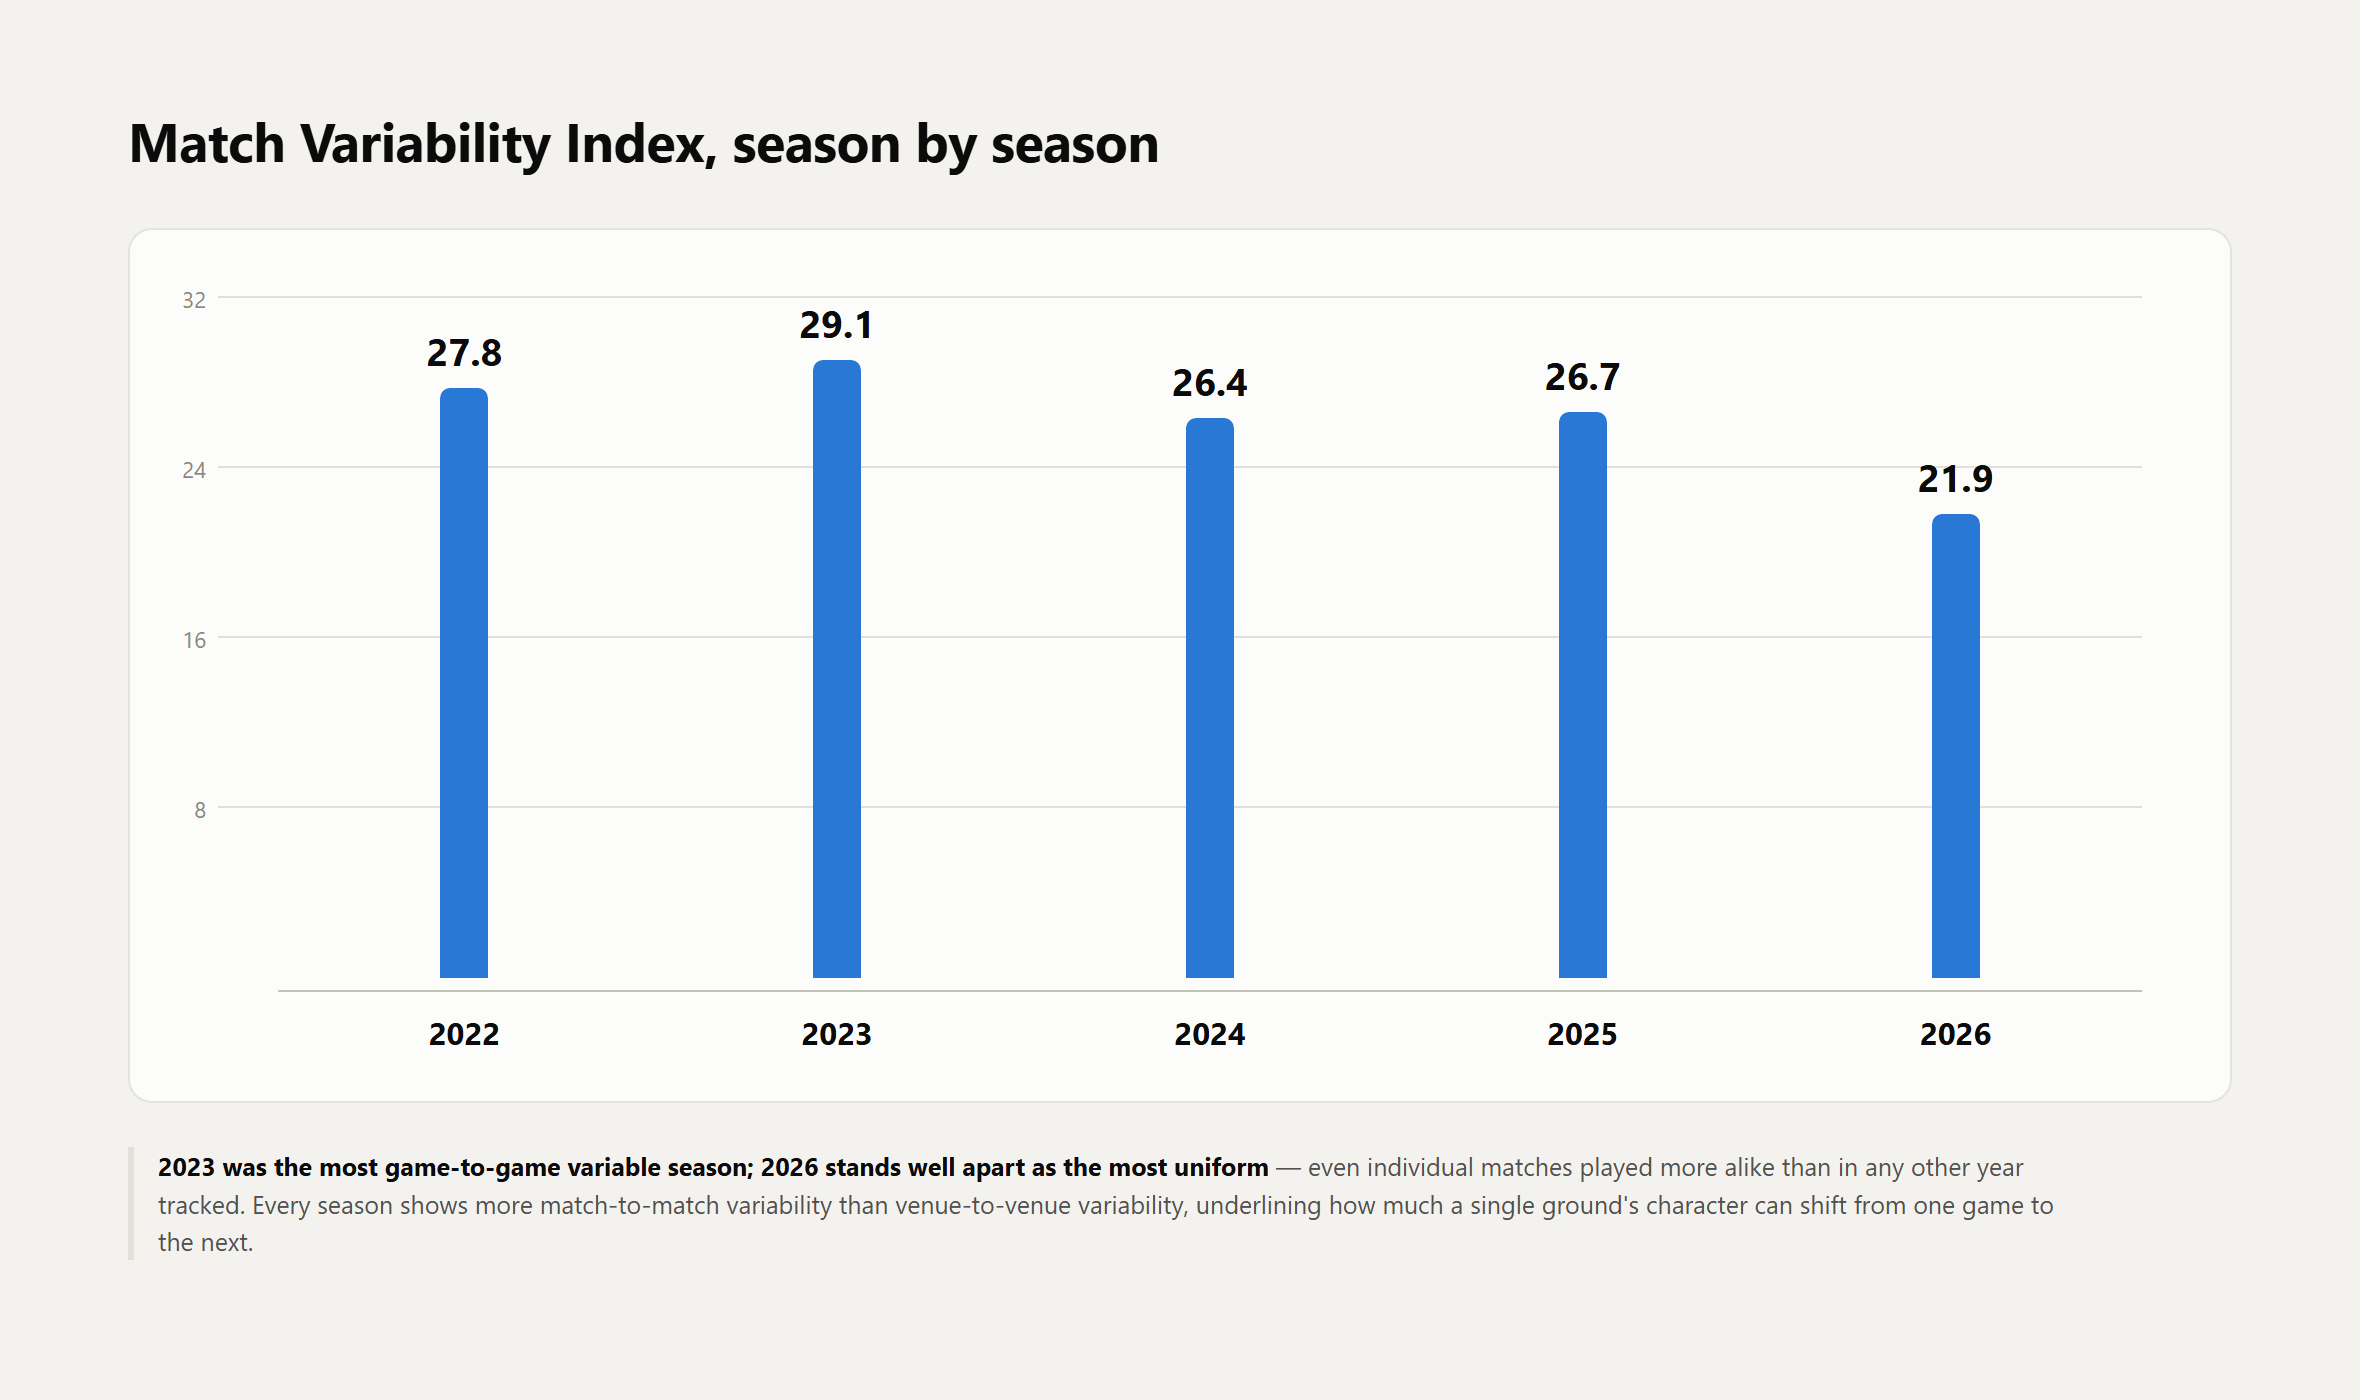
2022 scores highest on MVI, indicating that pitches changed significantly over the course of the tournament. The likely reason is the high number of games each venue hosted that season (20 each at Wankhede and DY Patil, 15 each at MCA and Brabourne). The low PVI, meanwhile, means the average pitch effect across venues remained similar throughout. 2026, on the other hand, takes a significant hit on match variability compared to previous years, suggesting pitches did not change much from game to game either. The metric-wise breakdown reinforces the same picture:
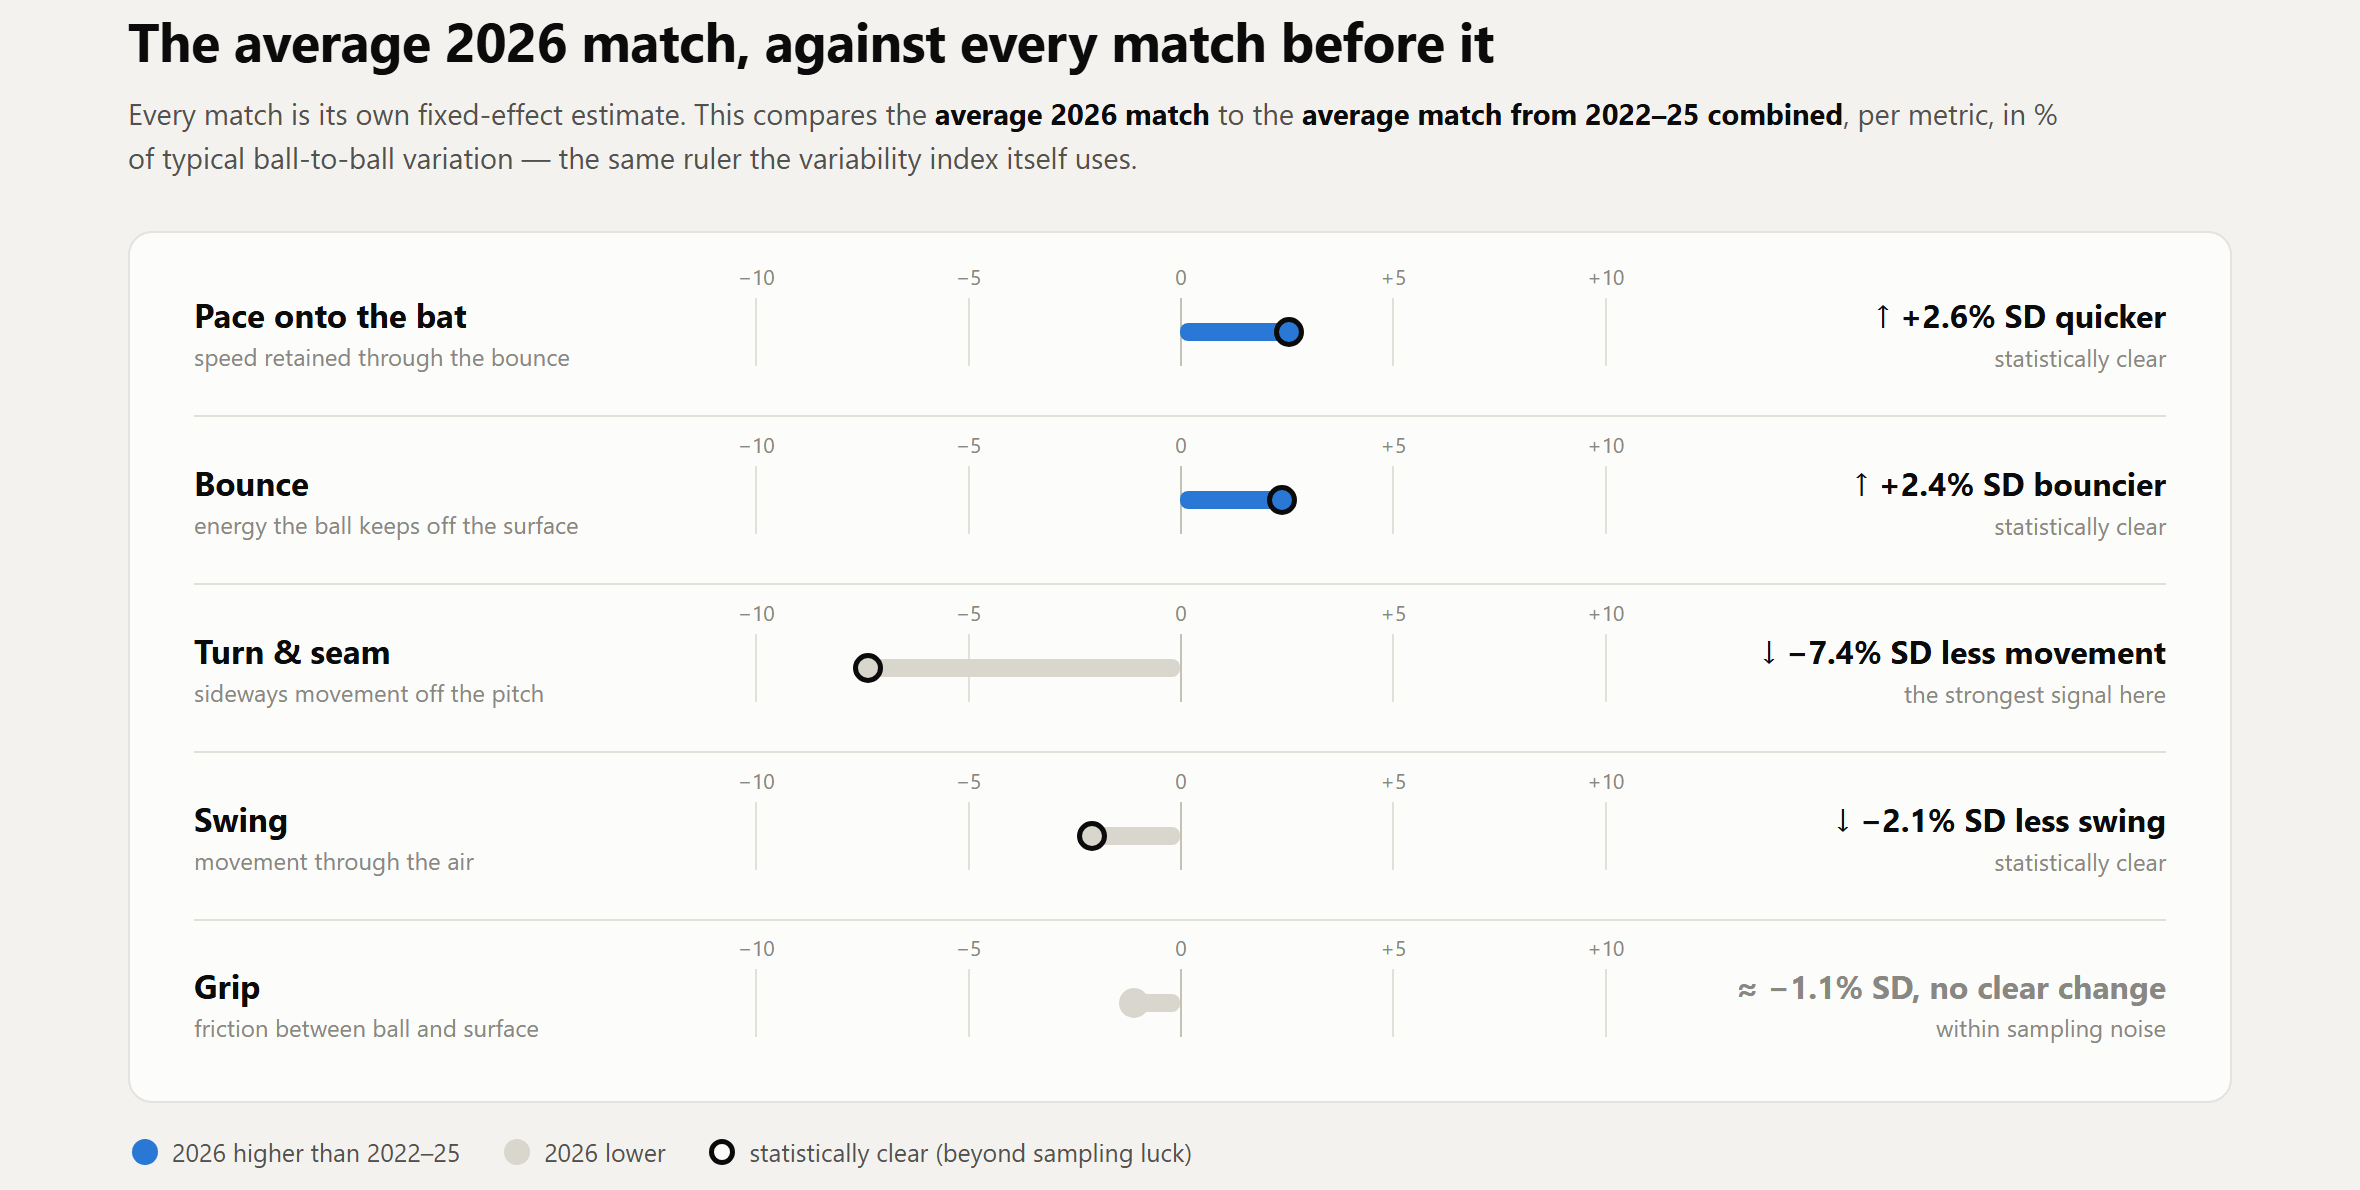
Better pace onto the bat, better bounce, turn and seam takes the biggest fall, swing declines as well.
The same MVI can be put to use to examine how much variability in conditions a particular player faced throughout the season. Interestingly, these were the MVI scores of the six batters who appeared in all seven away outings for India. Kishan, Abhishek and Axar, who batted on the most similar surfaces in IPL 2026, were also the most exposed to India’s short and back of a length problems discussed above.
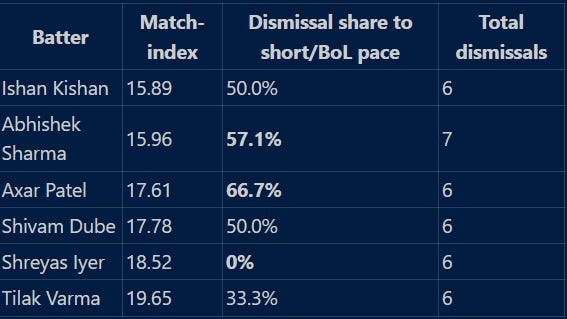
Outlier games this season leaned toward lower restitution and pace than the 2026 average. Slow and low surfaces stood out, but they were few and far between. Spinners in IPL shy away from flighting the ball or varying their pace on an unsupportive pitch, since any such invitation is liable to be put away. This is something Will Jacks used well against the Indian batters. A couple of his dismissals, Tilak and Dube, came down to little more than effective speed control and flight. Sam Curran is another bowler with expertise on these surfaces, and Indian batters repeatedly failed to put him away in the death overs, where he went at just 6.00 per over with 5 wickets in 6 overs across the series.
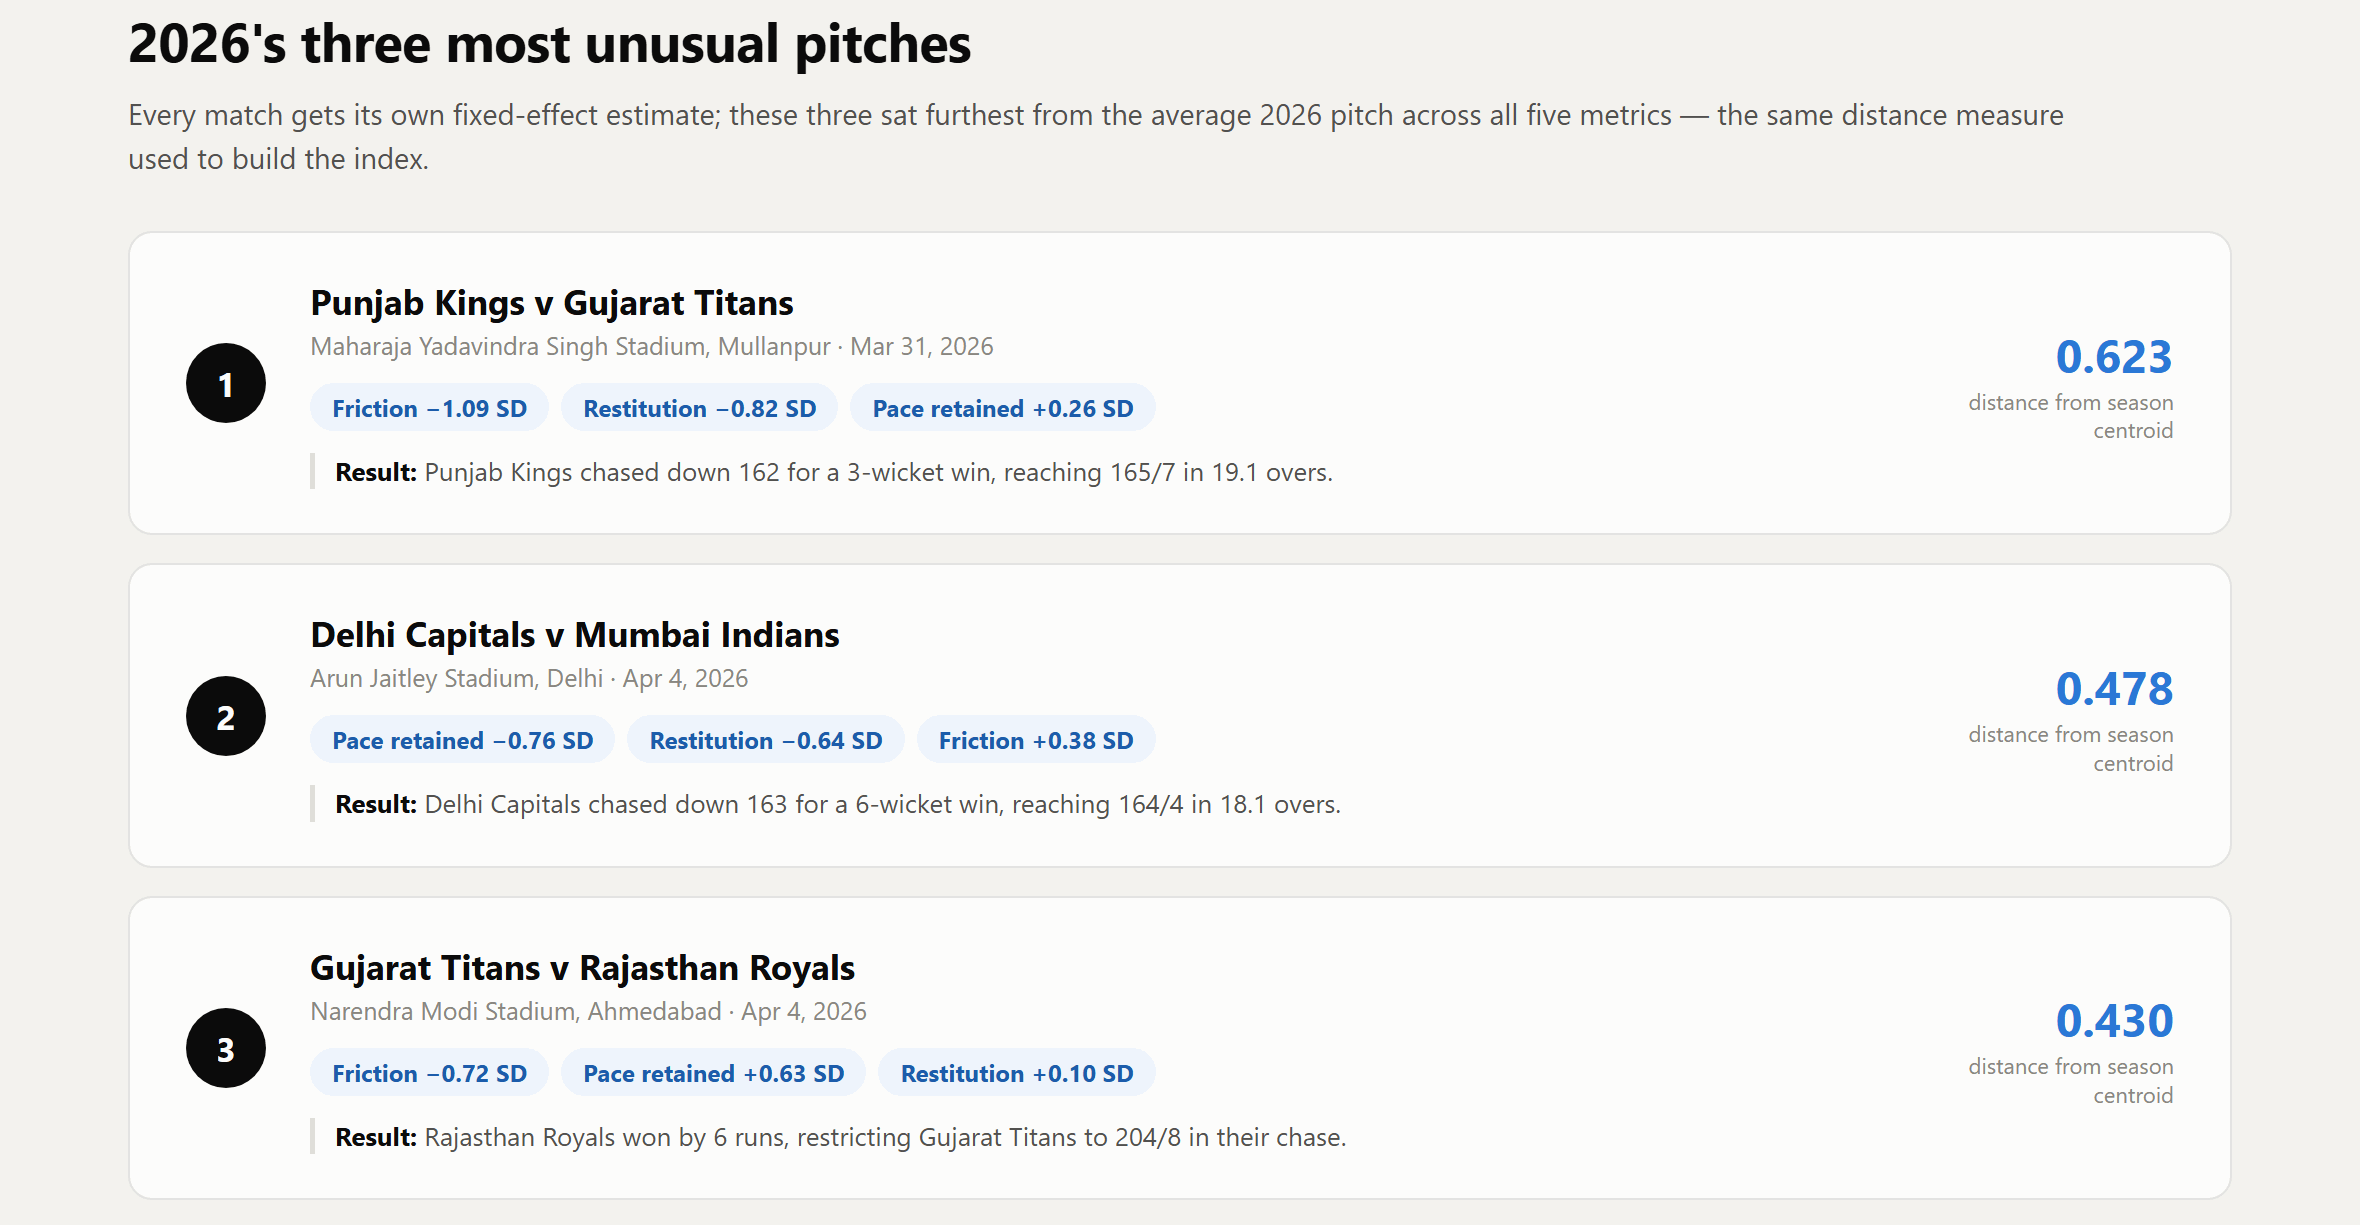
Mullanpur’s PBKS v GT and Delhi’s DC v MI games both offered low-bounce surfaces: Delhi’s pitch additionally had more grip and lower pace retention, with the ball coming slow onto the bat. The results were similar in both cases: the chasing team getting home with 160-odd in the last couple of overs.
Ahmedabad’s GT v RR was at the other extreme. Higher bounce than the season average and a much faster surface. The Royals successfully defended 210, winning by 6 runs.
All in all, a good illustration of how pitch differences influenced scoring patterns this season.
The numbers confirm what the eye test suggested: IPL pitches have grown flatter, truer, and more homogeneous over the last five seasons, with 2026 marking a new low in both venue and match variability. Recent Indian team results may not be as alarming as the discourse suggests, but from both a player development and a spectator standpoint, the IPL would do well to bring some variety back to its surfaces.
Why both restitution and pace-retention: restitution measures how much of the ball’s vertical speed survives the bounce (carry), pbr how much of its total speed does (skid onto the bat). A pitch can bounce big but slow, or stay low but quick, so the two capture genuinely different surface behaviours and overlap only ~40–50%.
Why not bounce angle: physics ties the quantities together (cor ≈ pbr × sin(bounce)/sin(drop), r = 0.93 in our data), making bounce angle ~90% redundant with restitution once delivery trajectory is controlled.
Including it would have silently double-counted the same “vertical bounce liveliness” dimension in the five-metric average, biasing the index toward bounce at the expense of grip, pace and turn.
Swing is a highly bowler-specific metric. We have not included the bowler as a factor in our mixed effects model due to sparsity, but adding it gave a +10.18% boost in swing’s explainability, the highest gain across any base metric. All results presented when accounting for the bowler should be taken with a pinch of salt.
What we obtain is an estimate of TPE, built from a finite sample of matches, and therefore carrying some sampling luck. We quantify that luck directly (by resampling each venue’s matches and watching how much its estimate wobbles) and subtract it from the venue-to-venue spread (before division by ball to ball SD in the above image), so the index only counts differences too large to be chance.
 | A guest post by
|
Magnificent work. I really appreciated the care that went into differentiating between player effects and pitch effects. I have only very few criticisms if you will indulge me: 1) controlling for confounders is a great way of eliminating many issues, but it's only as good as the extent of control data points we have available. The canonical example is skill, which is an unobservable. Is it possible that bowlers bowled with more skill on some pitches, and this is what is really causing what we are interpreting as venue effects? As an example, consider a Bumrah bowling a lot of deliveries at the Wankhede with his wacky action. I think the main FE model wouldn't be partialing out this effect. 2) at the same time, controlling for too many features with <100k observations leads to problems of overfitting. I do worry whether that might be an issue with this approach? Could an alternative be to look at the first ball bowled in a match alone, as I think Amol Desai has done, before player effects have had a say?
Fantastic piece of putting data to what goes off as popular discourse. So so well explained.